Hi All, I've a very strange question that I hope to explain eloquently.
I'm dealing with FW logs. Already wrote a grok parser that works like a charm (prefer not to provided it here, let me know if it's going to be needed?) and everything is fine, I receive the alerts as I want them in my SIEM.
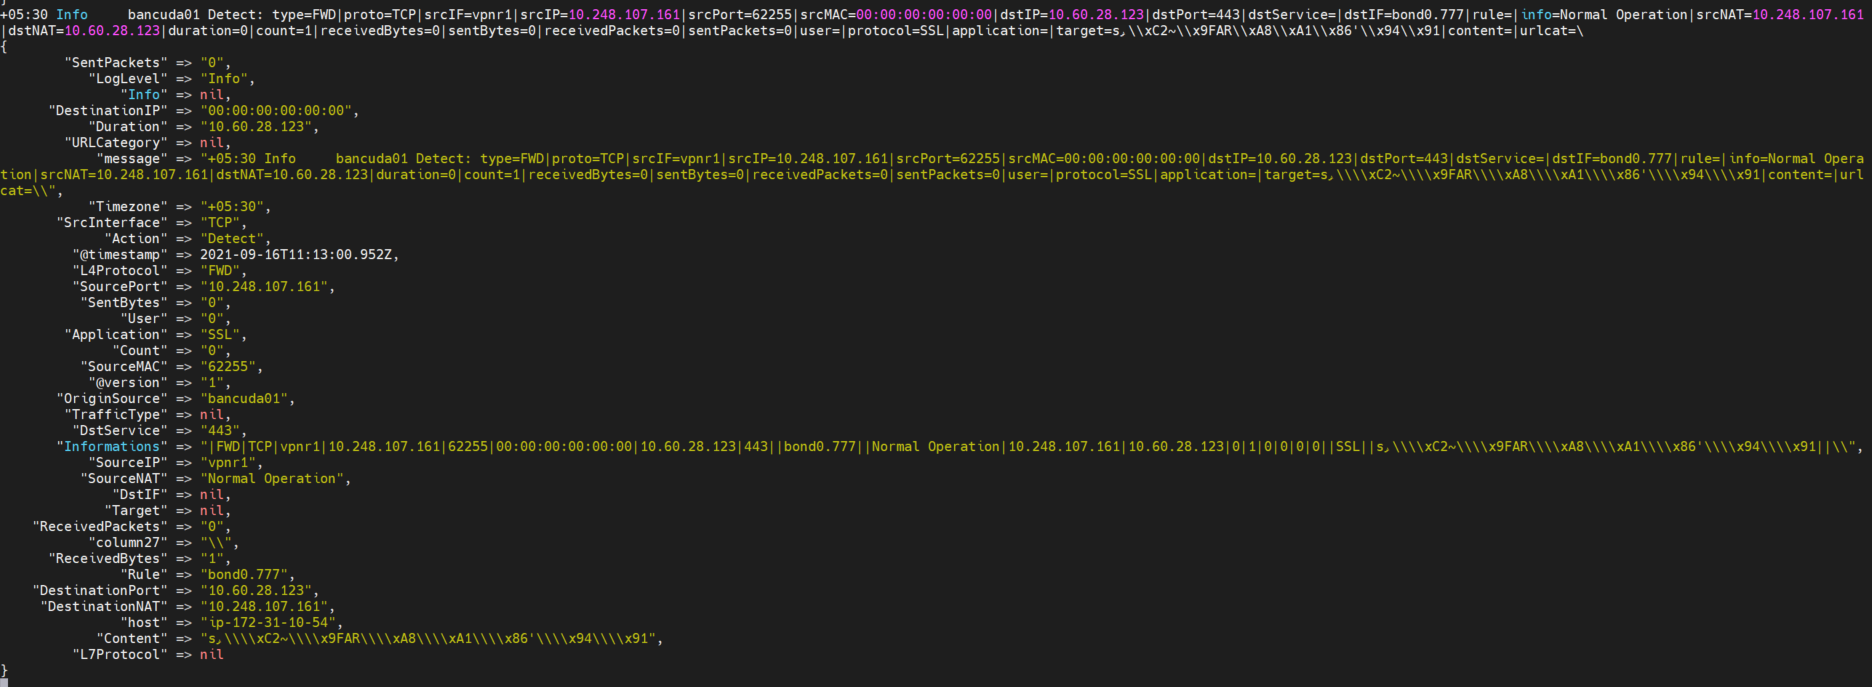
However when going through the log file /var/log/logstash/logstash-palin.log I can see some _grokparsefailures such as the below (I deliberately obfuscated some of the info)
************The log entry obfuscated*****************
+02:00 Info     XXX Remove: type=LIN|proto=UDP|srcIF=|srcIP=1.1.1.1|srcPort=691|srcMAC=FF:FF:FF:FF:FF:FF|dstIP=1.1.1.1|dstPort=691|dstService=XXX-MGMT|dstIF=p1.111|rule=OP-SRV-VPN|info=Unreachable Timeout|srcNAT=1.1.1.1|dstNAT=1.1.1.1|duration=-719825|count=1|receivedBytes=1255922857|sentBytes=41005632880|receivedPackets=7757015|sentPackets=37685863|user=|protocol=|application=|target=|content=|urlcat=
The odd thing is that when I use an online grok debugger such Grok Debugger or This One or This one the regex actually works and the log is being parsed exactly as I want. But for some reason this is still being tagged as _grokparsefailures in the log file and I can't see the log entries in my SIEM.
Now, one thing that comes to mind is that I have a cidr plugin in the logstash configuration that is checking if the source is external and if it is, it drops the entry.
In the dropped entries above the Source IP is indeed external (actually it is Company-owned, but I am checking against a particular private network and for it it's actually external). Having said that these entries should be dropped. So is it possible that by being dropped the log entries are actually flagged as _grokparsefailures? And why my parser fails since multiple online grok debuggers says otherwise?
Any response will be much appreciated. Thank you.