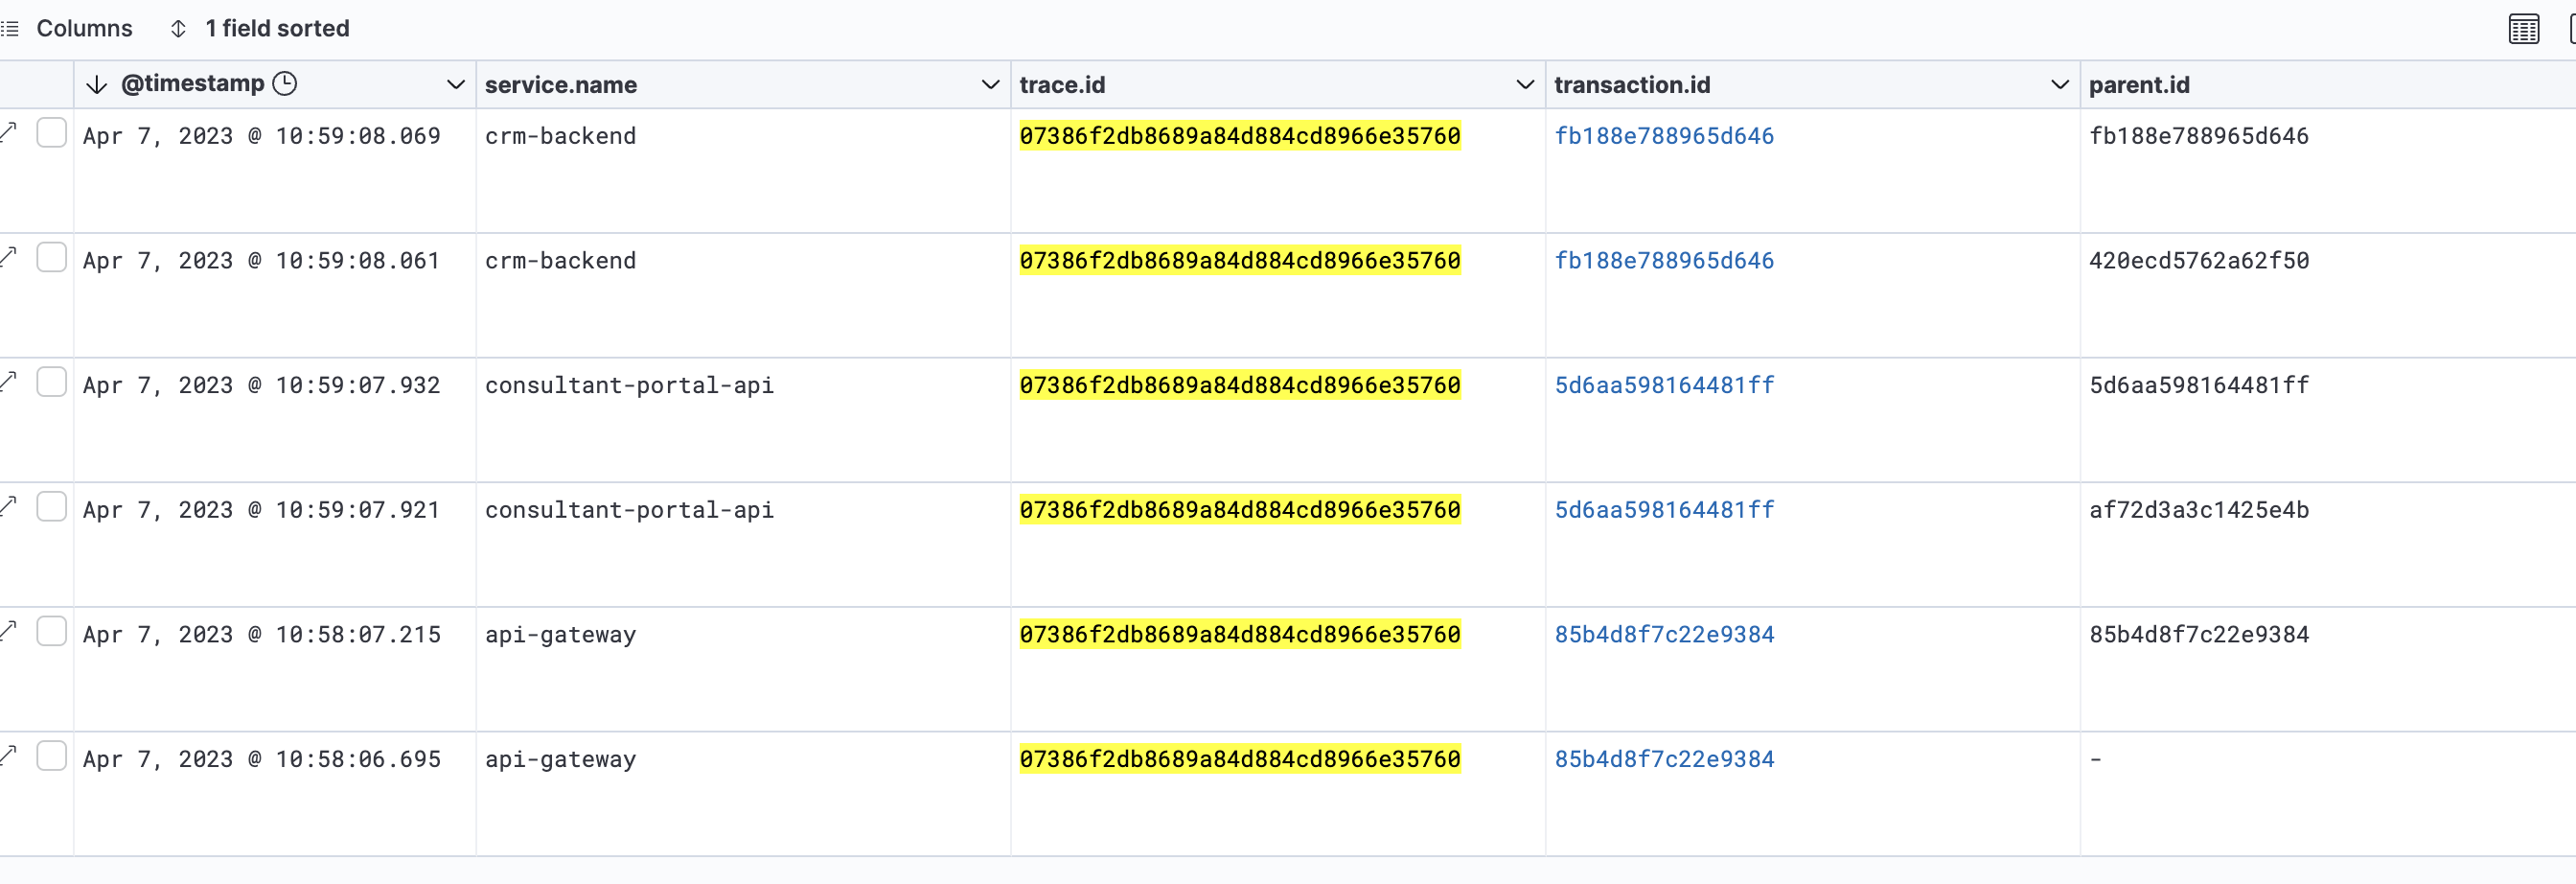
As you can see the trace consists of many transactions:
However when I open the first transaction I can see the trace chart not showing all the transactions, but just one of them
What could be the reason for such behaviour? Could it be because of the wrong "parent.id" ?
The call to "localhost" is a service invocation call via DAPR. DAPR is a side cart container that listens to calls on localhost and forwards them to other DAPR containers belonging to other services in the network based on the value of the "dapr-app-id" header.
Hi @Daniel_Khoroshko
What could be the reason for such behaviour? Could it be because of the wrong "parent.id" ?
Yes, it could be, but I don't see enough info here to verify.
One important thing to note is that the parent.id in case of an outgoing call points to a span (and not a transaction!) in the upstream service. Here is an example in a demo app about this. You can check the span.id in case of an outgoing HTTP call and then check the parent.id of the transaction in the downstream transaction. Those are the ones that need to match (and not the transaction.id of the upstream service and the parent.id in the downstream service).
The call to "localhost" is a service invocation call via DAPR. DAPR is a side cart container that listens to calls on localhost and forwards them to other DAPR containers belonging to other services in the network based on the value of the "dapr-app-id" header.
So, following the logic from above: you show a span named GET localhost on your 2. screenshot. I assume this is the very first service and it forwards the call to another DAPR container. This span has a span.id and then you have a 2. service where the trace.ids match across the 2 transactions. Could you please check if parent.id of the downstream transaction of the one you show on this screenshot matches the span.id of GET localhost? If that's not the case, then this is where it may go wrong.
Hi Greg
Thank you very much for such a detailed response. I didn't know that the span.id was so important, and you are correct in saying that the downstream transaction has a wrong parent.id that doesn't point to the original span
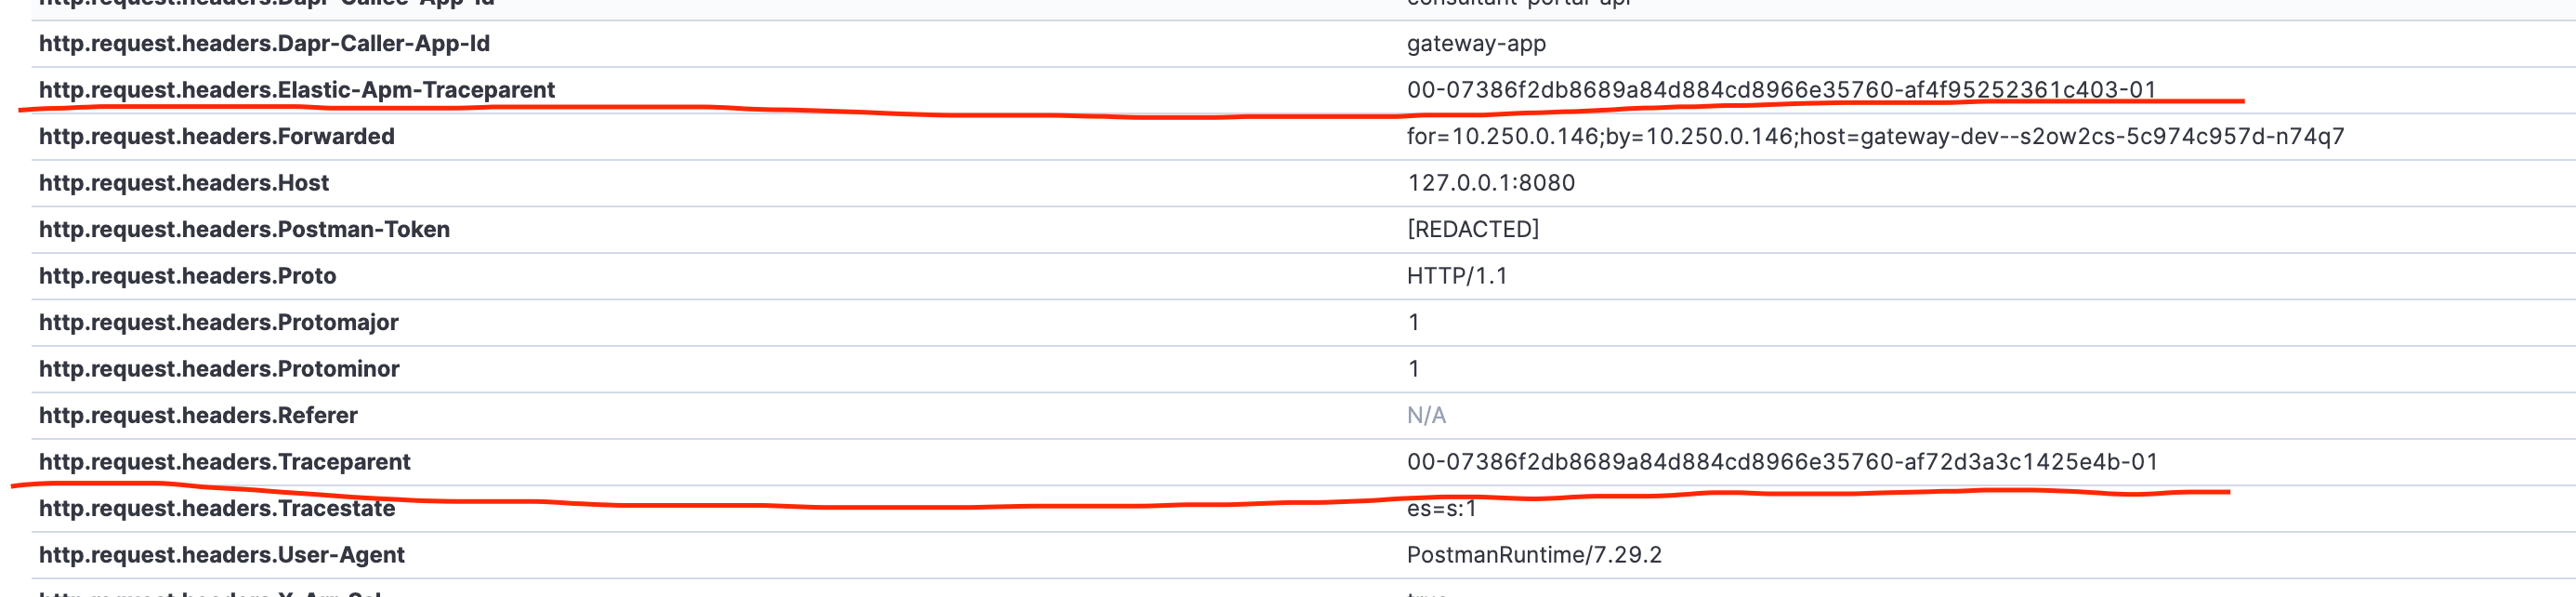
I've checked the properties of the downstream transaction and I can confirm that the second part of the traceparent header gets changed in DAPR. The good part is that the original header is preserved in the Elastic-Apm-Traceparent header.
I know that it is possible to export Open Telementry stats from DAPR and then import those into Elastic APM. However, this is not supported by the DAPR configuration that is exposed as a part of Azure Container Apps config.
I am going to investigate if it possible to export OTEL data to Elastic APM inside the azure-hosted DAPR and in case this is not possible I'll try to replace the traceparent header with the original one in the incoming requests, which should be good enough for our case
Thanks!
I was able to solve the problem in nodejs services by prioritising elastic apm traceparent over a regular traceparent header by patching the http-shared.js file in the postinstall script. The file is located inside node_modules/elastic-apm-node. Not the most elegant solution, but gets the job done
Not sure how to deal with dotnet services in this case, will think of a similar solution