I'm currently monitoring the log rate with Metricbeat on a Centos system. Now I would like to monitor all emitted log rate without sending all data to Elastic.
For example i have a connector installed which is sending data i want to monitor the data but don't want to send this data to Elastic.
(besides that i'm curious if log rate /s is the same as eps.)
Hey @tristan1, sorry, I think I am not following you, what log rate are you monitoring with Metricbeat?
And what do you mean by monitoring the data but not sending it to Elasticsearch?
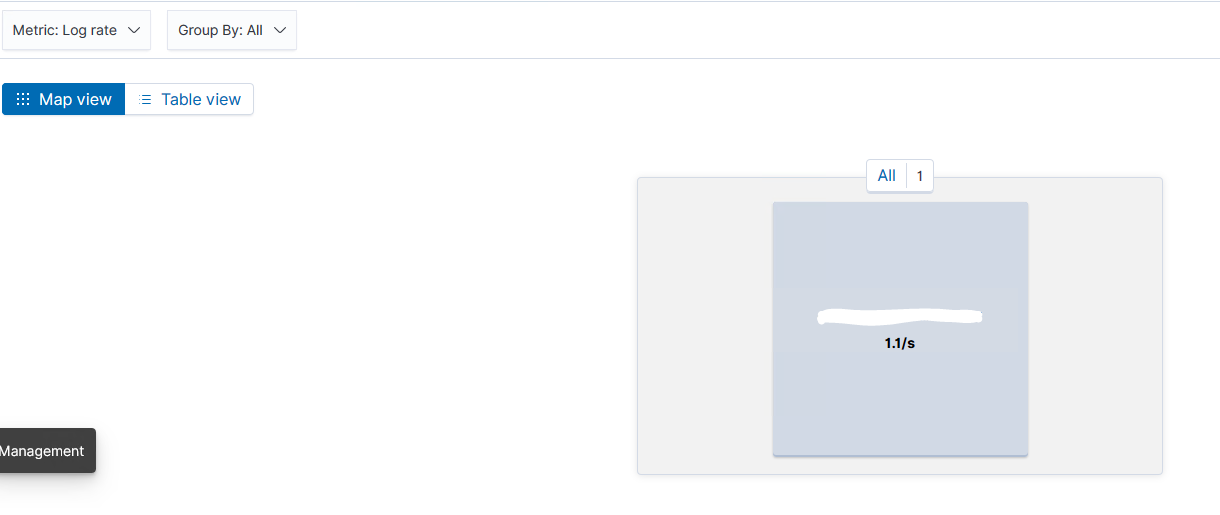
On the picture, you see the log rate of a system. On the same system I have a connector installed which sends data (not to Elastic). I would like to monitor the log rate of the connector of the same system and see it in the metric dashboard.
What i could do is add the path to the Filebeat and it will monitor the log rate, but the problem is that i need to send this data to Elastic. Therefore, I would like to monitor the data of the connector but not sending it to Elastic.
Yes, this is the number of log events produced per second. This is calculated counting events stored in Elasticsearch, so this won't work for data sent to other stores.
Apache, Apache Lucene, Apache Hadoop, Hadoop, HDFS and the yellow elephant
logo are trademarks of the
Apache Software Foundation
in the United States and/or other countries.