Not creating spans for PostgreSQL query running on APM .NET 6 Agent

Hi guys.
I'm trying to use APM Agent on my .Net Core Webapi (.NET 6) but it's not showing the database (PostgreSQL) connection and query spans. I've setup a sample application using Visual Studio 2022 to demonstrate.
I've also spent a lot of time trying to do the same on our other .NET Framework applications but also without success, but this one let's leave it for another discussion.
The only wait i could get it to work was mannually creating the Spans, but what we need is the auto instrumentation.
Also tried to use Npgsql 6.0.0 or 5.0.0 instead of the 6.0.5
I'll leave down bellow the full IIS and APM trace logs provided by VS 2022. Thanks if anyone could help.

Kibana version: 7.13.3

Elasticsearch version: 7.13.3

APM Server version: 7.13.3

APM Agent language and version: Elastic.Apm.NetCoreAll (.NET) - 1.16.1

Browser version: N/A

Original install method (e.g. download page, yum, deb, from source, etc.) and version:
NuGet - Visual Studio 2022
Fresh install or upgraded from other version?
Server, yes, fresh install.
Is there anything special in your setup? For example, are you using the Logstash or Kafka outputs? Are you using a load balancer in front of the APM Servers? Have you changed index pattern, generated custom templates, changed agent configuration etc.
Just a simples APM setup on Docker.
Description of the problem including expected versus actual behavior. Please include screenshots (if relevant):
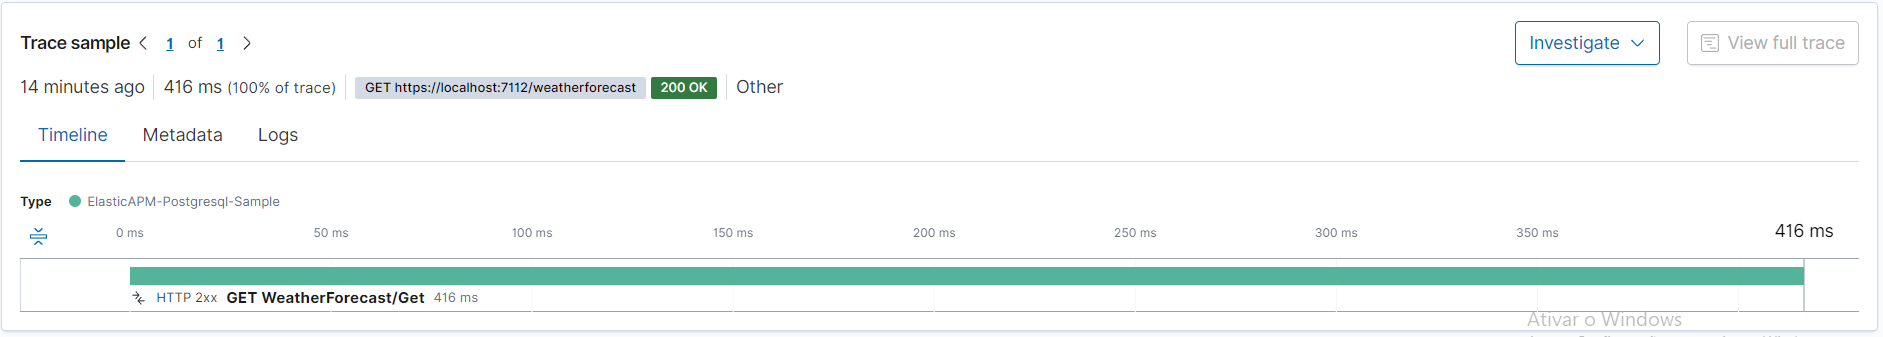
Expected: PostgreSQL connection query appears on transaction span, but it doesn't:

Steps to reproduce:
To reproduce i've setup a sample Visual Studio 2022 Webapi called Weather Forecast.

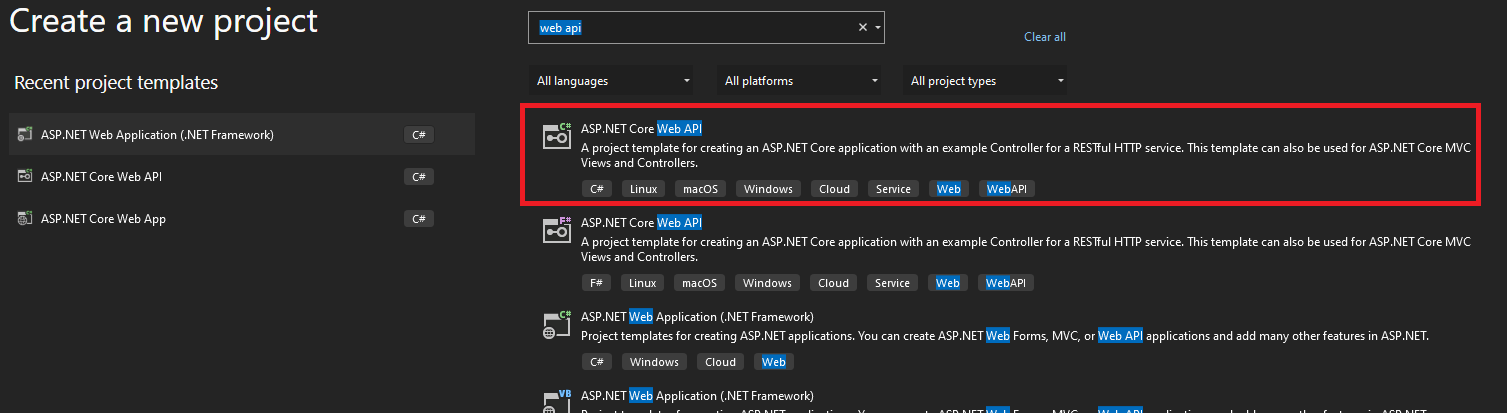
  1. Create a new project in Visual Studio 2022. ASP.NET Core Web API:


    Next Page:
    image
    Solution Created:

  2. Install the modules "Elastic.Apm.NetCoreAll 1.16.1" and "Npgsql v6.0.5":


  3. Setup the appsettings.conf configurations. Also set the log level to trace:

  4. Configure APM in Program.cs:

  5. Modify the WeatherForecastController.cs to execute a Postgresql query and return the result (query result will be 'postgres'):

  6. Execute the code and run a request via Postman:


    So the query get executed correctly and database connection was estabilished.

  7. Check the transation on APM. No query span was created and i can't see anything related to the query select * from information_schema.tables; on the APM logs:

Errors in browser console (if relevant):
N/A

Provide logs and/or server output (if relevant):

Elastic.Apm: Debug: {AbstractConfigurationReader (MicrosoftExtensionsConfig)} Service name provided in configuration is ElasticAPM-Postgresql-Sample
Elastic.Apm: Information: {AbstractConfigurationReader (MicrosoftExtensionsConfig)} The agent was started without a service version. The service version will be automatically discovered.
Elastic.Apm: Information: {AbstractConfigurationReader (MicrosoftExtensionsConfig)} The agent was started without a service version. The automatically discovered service version is 1.0.0
Elastic.Apm: Debug: {SystemInfoHelper} No /proc/self/cgroup found - the agent will not report container id
Elastic.Apm: Debug: {BackendCommUtils} Building HTTP client with BaseAddress: https://apm01:8200/ for BackendCommComponentBase (PayloadSenderV2)...
Elastic.Apm: Debug: {AbstractConfigurationReader (MicrosoftExtensionsConfig)} GlobalLabels configuration option doesn't have a valid value - using default (empty map)
Elastic.Apm: Debug: {AbstractConfigurationReader (MicrosoftExtensionsConfig)} MaxQueueEventCount configuration option doesn't have a valid value - using default: 1000
Elastic.Apm: Debug: {AbstractConfigurationReader (MicrosoftExtensionsConfig)} MaxBatchEventCount configuration option doesn't have a valid value - using default: 10
Elastic.Apm: Debug: {AbstractConfigurationReader (MicrosoftExtensionsConfig)} FlushInterval configuration option doesn't have a valid value - using default: 00:00:10
Elastic.Apm: Debug: {PayloadSenderV2} Using the following configuration options: Events intake API absolute URL: https://apm01:8200/intake/v2/events, FlushInterval: 10s, MaxBatchEventCount: 10, MaxQueueEventCount: 1000
Elastic.Apm: Debug: {BackendCommComponentBase (PayloadSenderV2)} Waiting for work loop started event...
Elastic.Apm: Debug: {BackendCommComponentBase (PayloadSenderV2)} Signaling work loop started event...
Elastic.Apm: Debug: {BackendCommComponentBase (PayloadSenderV2)} Work loop started signaled
Elastic.Apm: Debug: {AbstractConfigurationReader (MicrosoftExtensionsConfig)} CentralConfig configuration option doesn't have a valid value - using default: True
Elastic.Apm: Debug: {BackendCommUtils} Building HTTP client with BaseAddress: https://apm01:8200/ for BackendCommComponentBase (CentralConfigurationFetcher)...
Elastic.Apm: Debug: {AbstractConfigurationReader (MicrosoftExtensionsConfig)} CentralConfig configuration option doesn't have a valid value - using default: True
Elastic.Apm: Debug: {CentralConfigurationFetcher} Central configuration feature is enabled because CentralConfig option's value is True (default value is True)
Elastic.Apm: Debug: {AbstractConfigurationReader (MicrosoftExtensionsConfig)} CentralConfig configuration option doesn't have a valid value - using default: True
Elastic.Apm: Debug: {CentralConfigurationFetcher} Combined absolute URL for APM Server get central configuration endpoint: `https://apm01:8200/config/v1/agents?service.name=ElasticAPM-Postgresql-Sample&service.environment=Development'. Service: Service{Name: ElasticAPM-Postgresql-Sample, Version: 1.0.0, Environment: Development, Runtime: Runtime{Name: .NET 6, Version: 6.0.6}, Framework: null, Agent: AgentC{Name: dotnet, Version: 1.16.1+896f164721034998eaae468029611a1195487013}, Language: null, Node: Node{ConfiguredName: null}}.
Elastic.Apm: Debug: {BackendCommComponentBase (CentralConfigurationFetcher)} Waiting for work loop started event...
Elastic.Apm: Debug: {BackendCommComponentBase (CentralConfigurationFetcher)} Signaling work loop started event...
Elastic.Apm: Debug: {BackendCommComponentBase (CentralConfigurationFetcher)} Work loop started signaled
Elastic.Apm: Trace: {CentralConfigurationFetcher} Making HTTP request to APM Server... Request: https://apm01:8200/config/v1/agents?service.name=ElasticAPM-Postgresql-Sample&service.environment=Development.
Elastic.Apm: Trace: {GcEventListener} Initialize GcEventListener to collect GC metrics
Elastic.Apm: Trace: {CgroupMetricsProvider} CgroupMetricsProvider detected a non Linux OS, therefore Cgroup metrics will not be reported
Elastic.Apm: Information: {MetricsCollector} Collecting metrics in 30000 milliseconds interval
Elastic.Apm: Trace: Initialization - Agent.Setup called. Callstack:    at Elastic.Apm.Agent.Setup(AgentComponents agentComponents)
   at Elastic.Apm.AspNetCore.ApmMiddlewareExtension.UseElasticApm(IApplicationBuilder builder, IConfiguration configuration, IDiagnosticsSubscriber[] subscribers)
   at Program.<Main>$(String[] args)

Elastic.Apm: Debug: {HttpDiagnosticListener} Current runtime is not detected as Full Framework - returning implementation for Core. RuntimeInformation.FrameworkDescription: .NET 6.0.6
Elastic.Apm: Debug: {DiagnosticInitializer} Subscribed Elastic.Apm.DiagnosticListeners.HttpDiagnosticListenerCoreImpl to `HttpHandlerDiagnosticListener' events source
Elastic.Apm: Trace: {DiagnosticInitializer} There are no listeners in the current batch (Elastic.Apm.EntityFrameworkCore.EfCoreDiagnosticListener) that would like to subscribe to `HttpHandlerDiagnosticListener' events source
Elastic.Apm: Trace: {DiagnosticInitializer} There are no listeners in the current batch (Elastic.Apm.SqlClient.SqlClientDiagnosticListener) that would like to subscribe to `HttpHandlerDiagnosticListener' events source
Elastic.Apm: Trace: {DiagnosticInitializer} There are no listeners in the current batch (Elastic.Apm.Elasticsearch.AuditDiagnosticsListener, Elastic.Apm.Elasticsearch.RequestPipelineDiagnosticsListener, Elastic.Apm.Elasticsearch.HttpConnectionDiagnosticsListener, Elastic.Apm.Elasticsearch.SerializerDiagnosticsListener) that would like to subscribe to `HttpHandlerDiagnosticListener' events source
Elastic.Apm: Trace: {DiagnosticInitializer} There are no listeners in the current batch (Elastic.Apm.GrpcClient.GrpcClientDiagnosticListener) that would like to subscribe to `HttpHandlerDiagnosticListener' events source
Elastic.Apm: Trace: {DiagnosticInitializer} There are no listeners in the current batch (Elastic.Apm.Azure.ServiceBus.AzureMessagingServiceBusDiagnosticListener) that would like to subscribe to `HttpHandlerDiagnosticListener' events source
Elastic.Apm: Trace: {DiagnosticInitializer} There are no listeners in the current batch (Elastic.Apm.Azure.ServiceBus.MicrosoftAzureServiceBusDiagnosticListener) that would like to subscribe to `HttpHandlerDiagnosticListener' events source
Elastic.Apm: Trace: {DiagnosticInitializer} There are no listeners in the current batch (Elastic.Apm.Azure.Storage.AzureBlobStorageDiagnosticListener, Elastic.Apm.Azure.Storage.AzureCoreDiagnosticListener) that would like to subscribe to `HttpHandlerDiagnosticListener' events source
Elastic.Apm: Trace: {DiagnosticInitializer} There are no listeners in the current batch (Elastic.Apm.Azure.Storage.AzureQueueStorageDiagnosticListener, Elastic.Apm.Azure.Storage.AzureCoreDiagnosticListener) that would like to subscribe to `HttpHandlerDiagnosticListener' events source
Elastic.Apm: Trace: {DiagnosticInitializer} There are no listeners in the current batch (Elastic.Apm.Azure.Storage.AzureFileShareStorageDiagnosticListener, Elastic.Apm.Azure.Storage.AzureCoreDiagnosticListener) that would like to subscribe to `HttpHandlerDiagnosticListener' events source
Elastic.Apm: Trace: {DiagnosticInitializer} There are no listeners in the current batch (Elastic.Apm.MongoDb.DiagnosticSource.MongoDiagnosticListener) that would like to subscribe to `HttpHandlerDiagnosticListener' events source
Elastic.Apm: Trace: {DiagnosticInitializer} There are no listeners in the current batch (Elastic.Apm.AspNetCore.DiagnosticListener.AspNetCoreErrorDiagnosticListener) that would like to subscribe to `HttpHandlerDiagnosticListener' events source
Elastic.Apm: Debug: {DiagnosticInitializer} Subscribed Elastic.Apm.AspNetCore.DiagnosticListener.AspNetCoreErrorDiagnosticListener to `Microsoft.AspNetCore' events source
Elastic.Apm: Trace: {DiagnosticInitializer} There are no listeners in the current batch (Elastic.Apm.MongoDb.DiagnosticSource.MongoDiagnosticListener) that would like to subscribe to `Microsoft.AspNetCore' events source
Elastic.Apm: Trace: {DiagnosticInitializer} There are no listeners in the current batch (Elastic.Apm.Azure.Storage.AzureFileShareStorageDiagnosticListener, Elastic.Apm.Azure.Storage.AzureCoreDiagnosticListener) that would like to subscribe to `Microsoft.AspNetCore' events source
Elastic.Apm: Trace: {DiagnosticInitializer} There are no listeners in the current batch (Elastic.Apm.Azure.Storage.AzureQueueStorageDiagnosticListener, Elastic.Apm.Azure.Storage.AzureCoreDiagnosticListener) that would like to subscribe to `Microsoft.AspNetCore' events source
Elastic.Apm: Trace: {DiagnosticInitializer} There are no listeners in the current batch (Elastic.Apm.Azure.Storage.AzureBlobStorageDiagnosticListener, Elastic.Apm.Azure.Storage.AzureCoreDiagnosticListener) that would like to subscribe to `Microsoft.AspNetCore' events source
Elastic.Apm: Trace: {DiagnosticInitializer} There are no listeners in the current batch (Elastic.Apm.Azure.ServiceBus.MicrosoftAzureServiceBusDiagnosticListener) that would like to subscribe to `Microsoft.AspNetCore' events source
Elastic.Apm: Trace: {DiagnosticInitializer} There are no listeners in the current batch (Elastic.Apm.Azure.ServiceBus.AzureMessagingServiceBusDiagnosticListener) that would like to subscribe to `Microsoft.AspNetCore' events source
Elastic.Apm: Trace: {DiagnosticInitializer} There are no listeners in the current batch (Elastic.Apm.GrpcClient.GrpcClientDiagnosticListener) that would like to subscribe to `Microsoft.AspNetCore' events source
Elastic.Apm: Trace: {DiagnosticInitializer} There are no listeners in the current batch (Elastic.Apm.Elasticsearch.AuditDiagnosticsListener, Elastic.Apm.Elasticsearch.RequestPipelineDiagnosticsListener, Elastic.Apm.Elasticsearch.HttpConnectionDiagnosticsListener, Elastic.Apm.Elasticsearch.SerializerDiagnosticsListener) that would like to subscribe to `Microsoft.AspNetCore' events source
Elastic.Apm: Trace: {DiagnosticInitializer} There are no listeners in the current batch (Elastic.Apm.SqlClient.SqlClientDiagnosticListener) that would like to subscribe to `Microsoft.AspNetCore' events source
Elastic.Apm: Trace: {DiagnosticInitializer} There are no listeners in the current batch (Elastic.Apm.EntityFrameworkCore.EfCoreDiagnosticListener) that would like to subscribe to `Microsoft.AspNetCore' events source
Elastic.Apm: Trace: {DiagnosticInitializer} There are no listeners in the current batch (Elastic.Apm.DiagnosticListeners.HttpDiagnosticListenerCoreImpl) that would like to subscribe to `Microsoft.AspNetCore' events source
Elastic.Apm: Trace: {AwsCloudMetadataProvider} Unable to get aws cloud metadata. The application is likely not running in aws

System.Net.Http.HttpRequestException: Uma operação de soquete foi tentada em uma rede inacessível. (169.254.169.254:80)
 ---> System.Net.Sockets.SocketException (10051): Uma operação de soquete foi tentada em uma rede inacessível.
   at System.Net.Sockets.Socket.AwaitableSocketAsyncEventArgs.ThrowException(SocketError error, CancellationToken cancellationToken)
   at System.Net.Sockets.Socket.AwaitableSocketAsyncEventArgs.System.Threading.Tasks.Sources.IValueTaskSource.GetResult(Int16 token)
   at System.Net.Sockets.Socket.<ConnectAsync>g__WaitForConnectWithCancellation|277_0(AwaitableSocketAsyncEventArgs saea, ValueTask connectTask, CancellationToken cancellationToken)
   at System.Net.Http.HttpConnectionPool.ConnectToTcpHostAsync(String host, Int32 port, HttpRequestMessage initialRequest, Boolean async, CancellationToken cancellationToken)
   --- End of inner exception stack trace ---
   at System.Net.Http.HttpConnectionPool.ConnectToTcpHostAsync(String host, Int32 port, HttpRequestMessage initialRequest, Boolean async, CancellationToken cancellationToken)
   at System.Net.Http.HttpConnectionPool.ConnectAsync(HttpRequestMessage request, Boolean async, CancellationToken cancellationToken)
   at System.Net.Http.HttpConnectionPool.CreateHttp11ConnectionAsync(HttpRequestMessage request, Boolean async, CancellationToken cancellationToken)
   at System.Net.Http.HttpConnectionPool.AddHttp11ConnectionAsync(HttpRequestMessage request)
   at System.Threading.Tasks.TaskCompletionSourceWithCancellation`1.WaitWithCancellationAsync(CancellationToken cancellationToken)
   at System.Net.Http.HttpConnectionPool.GetHttp11ConnectionAsync(HttpRequestMessage request, Boolean async, CancellationToken cancellationToken)
   at System.Net.Http.HttpConnectionPool.SendWithVersionDetectionAndRetryAsync(HttpRequestMessage request, Boolean async, Boolean doRequestAuth, CancellationToken cancellationToken)
   at System.Net.Http.RedirectHandler.SendAsync(HttpRequestMessage request, Boolean async, CancellationToken cancellationToken)
   at System.Net.Http.HttpClient.<SendAsync>g__Core|83_0(HttpRequestMessage request, HttpCompletionOption completionOption, CancellationTokenSource cts, Boolean disposeCts, CancellationTokenSource pendingRequestsCts, CancellationToken originalCancellationToken)
   at Elastic.Apm.Cloud.AwsCloudMetadataProvider.GetMetadataAsync()
Elastic.Apm: Trace: {HttpDiagnosticListenerCoreImpl} Called with key: `System.Net.Http.HttpRequestOut.Start'
Elastic.Apm: Trace: {HttpDiagnosticListenerCoreImpl} Processing start event... Request URL: http://metadata.google.internal/computeMetadata/v1/?recursive=true
Elastic.Apm: Debug: {HttpDiagnosticListenerCoreImpl} No current transaction, skip creating span for outgoing HTTP request
Elastic.Apm: Trace: {HttpDiagnosticListenerCoreImpl} Called with key: `System.Net.Http.Request'
Elastic.Apm: Trace: {HttpDiagnosticListenerCoreImpl} Unrecognized key `System.Net.Http.Request'
Elastic.Apm: Trace: {HttpDiagnosticListenerCoreImpl} Called with key: `System.Net.Http.Exception'
Elastic.Apm: Trace: {HttpDiagnosticListenerCoreImpl} Processing exception event... Request URL: http://metadata.google.internal/computeMetadata/v1/?recursive=true
Elastic.Apm: Trace: {HttpDiagnosticListenerCoreImpl} Called with key: `System.Net.Http.HttpRequestOut.Stop'
Elastic.Apm: Trace: {HttpDiagnosticListenerCoreImpl} Processing stop event... Request URL: http://metadata.google.internal/computeMetadata/v1/?recursive=true
Elastic.Apm: Debug: {HttpDiagnosticListenerCoreImpl} ProcessStopEvent called with no active current transaction, url: http://metadata.google.internal/computeMetadata/v1/?recursive=true - skipping event
Elastic.Apm: Trace: {HttpDiagnosticListenerCoreImpl} Called with key: `System.Net.Http.Response'
Elastic.Apm: Trace: {HttpDiagnosticListenerCoreImpl} Event's Request property is null - exiting
Elastic.Apm: Trace: {GcpCloudMetadataProvider} Unable to get gcp cloud metadata. The application is likely not running in gcp

System.Net.Http.HttpRequestException: Este host não é conhecido. (metadata.google.internal:80)
 ---> System.Net.Sockets.SocketException (11001): Este host não é conhecido.
   at System.Net.Sockets.Socket.AwaitableSocketAsyncEventArgs.ThrowException(SocketError error, CancellationToken cancellationToken)
   at System.Net.Sockets.Socket.AwaitableSocketAsyncEventArgs.System.Threading.Tasks.Sources.IValueTaskSource.GetResult(Int16 token)
   at System.Net.Sockets.Socket.<ConnectAsync>g__WaitForConnectWithCancellation|277_0(AwaitableSocketAsyncEventArgs saea, ValueTask connectTask, CancellationToken cancellationToken)
   at System.Net.Http.HttpConnectionPool.ConnectToTcpHostAsync(String host, Int32 port, HttpRequestMessage initialRequest, Boolean async, CancellationToken cancellationToken)
   --- End of inner exception stack trace ---
   at System.Net.Http.HttpConnectionPool.ConnectToTcpHostAsync(String host, Int32 port, HttpRequestMessage initialRequest, Boolean async, CancellationToken cancellationToken)
   at System.Net.Http.HttpConnectionPool.ConnectAsync(HttpRequestMessage request, Boolean async, CancellationToken cancellationToken)
   at System.Net.Http.HttpConnectionPool.CreateHttp11ConnectionAsync(HttpRequestMessage request, Boolean async, CancellationToken cancellationToken)
   at System.Net.Http.HttpConnectionPool.AddHttp11ConnectionAsync(HttpRequestMessage request)
   at System.Threading.Tasks.TaskCompletionSourceWithCancellation`1.WaitWithCancellationAsync(CancellationToken cancellationToken)
   at System.Net.Http.HttpConnectionPool.GetHttp11ConnectionAsync(HttpRequestMessage request, Boolean async, CancellationToken cancellationToken)
   at System.Net.Http.HttpConnectionPool.SendWithVersionDetectionAndRetryAsync(HttpRequestMessage request, Boolean async, Boolean doRequestAuth, CancellationToken cancellationToken)
   at System.Net.Http.DiagnosticsHandler.SendAsyncCore(HttpRequestMessage request, Boolean async, CancellationToken cancellationToken)
   at System.Net.Http.RedirectHandler.SendAsync(HttpRequestMessage request, Boolean async, CancellationToken cancellationToken)
   at System.Net.Http.HttpClient.<SendAsync>g__Core|83_0(HttpRequestMessage request, HttpCompletionOption completionOption, CancellationTokenSource cts, Boolean disposeCts, CancellationTokenSource pendingRequestsCts, CancellationToken originalCancellationToken)
   at Elastic.Apm.Cloud.GcpCloudMetadataProvider.GetMetadataAsync()
Elastic.Apm: Trace: {HttpDiagnosticListenerCoreImpl} Called with key: `System.Net.Http.HttpRequestOut.Start'
Elastic.Apm: Trace: {HttpDiagnosticListenerCoreImpl} Processing start event... Request URL: http://169.254.169.254/metadata/instance/compute?api-version=2019-08-15
Elastic.Apm: Debug: {HttpDiagnosticListenerCoreImpl} No current transaction, skip creating span for outgoing HTTP request
Elastic.Apm: Trace: {HttpDiagnosticListenerCoreImpl} Called with key: `System.Net.Http.Request'
Elastic.Apm: Trace: {HttpDiagnosticListenerCoreImpl} Unrecognized key `System.Net.Http.Request'
Elastic.Apm: Trace: {HttpDiagnosticListenerCoreImpl} Called with key: `System.Net.Http.Exception'
Elastic.Apm: Trace: {HttpDiagnosticListenerCoreImpl} Processing exception event... Request URL: http://169.254.169.254/metadata/instance/compute?api-version=2019-08-15
Elastic.Apm: Trace: {HttpDiagnosticListenerCoreImpl} Called with key: `System.Net.Http.HttpRequestOut.Stop'
Elastic.Apm: Trace: {HttpDiagnosticListenerCoreImpl} Processing stop event... Request URL: http://169.254.169.254/metadata/instance/compute?api-version=2019-08-15
Elastic.Apm: Debug: {HttpDiagnosticListenerCoreImpl} ProcessStopEvent called with no active current transaction, url: http://169.254.169.254/metadata/instance/compute?api-version=2019-08-15 - skipping event
Elastic.Apm: Trace: {HttpDiagnosticListenerCoreImpl} Called with key: `System.Net.Http.Response'
Elastic.Apm: Trace: {HttpDiagnosticListenerCoreImpl} Event's Request property is null - exiting
Elastic.Apm: Trace: {AzureCloudMetadataProvider} Unable to get azure cloud metadata. The application is likely not running in azure

System.Net.Http.HttpRequestException: Uma operação de soquete foi tentada em uma rede inacessível. (169.254.169.254:80)
 ---> System.Net.Sockets.SocketException (10051): Uma operação de soquete foi tentada em uma rede inacessível.
   at System.Net.Sockets.Socket.AwaitableSocketAsyncEventArgs.ThrowException(SocketError error, CancellationToken cancellationToken)
   at System.Net.Sockets.Socket.AwaitableSocketAsyncEventArgs.System.Threading.Tasks.Sources.IValueTaskSource.GetResult(Int16 token)
   at System.Net.Sockets.Socket.<ConnectAsync>g__WaitForConnectWithCancellation|277_0(AwaitableSocketAsyncEventArgs saea, ValueTask connectTask, CancellationToken cancellationToken)
   at System.Net.Http.HttpConnectionPool.ConnectToTcpHostAsync(String host, Int32 port, HttpRequestMessage initialRequest, Boolean async, CancellationToken cancellationToken)
   --- End of inner exception stack trace ---
   at System.Net.Http.HttpConnectionPool.ConnectToTcpHostAsync(String host, Int32 port, HttpRequestMessage initialRequest, Boolean async, CancellationToken cancellationToken)
   at System.Net.Http.HttpConnectionPool.ConnectAsync(HttpRequestMessage request, Boolean async, CancellationToken cancellationToken)
   at System.Net.Http.HttpConnectionPool.CreateHttp11ConnectionAsync(HttpRequestMessage request, Boolean async, CancellationToken cancellationToken)
   at System.Net.Http.HttpConnectionPool.AddHttp11ConnectionAsync(HttpRequestMessage request)
   at System.Threading.Tasks.TaskCompletionSourceWithCancellation`1.WaitWithCancellationAsync(CancellationToken cancellationToken)
   at System.Net.Http.HttpConnectionPool.GetHttp11ConnectionAsync(HttpRequestMessage request, Boolean async, CancellationToken cancellationToken)
   at System.Net.Http.HttpConnectionPool.SendWithVersionDetectionAndRetryAsync(HttpRequestMessage request, Boolean async, Boolean doRequestAuth, CancellationToken cancellationToken)
   at System.Net.Http.DiagnosticsHandler.SendAsyncCore(HttpRequestMessage request, Boolean async, CancellationToken cancellationToken)
   at System.Net.Http.RedirectHandler.SendAsync(HttpRequestMessage request, Boolean async, CancellationToken cancellationToken)
   at System.Net.Http.HttpClient.<SendAsync>g__Core|83_0(HttpRequestMessage request, HttpCompletionOption completionOption, CancellationTokenSource cts, Boolean disposeCts, CancellationTokenSource pendingRequestsCts, CancellationToken originalCancellationToken)
   at Elastic.Apm.Cloud.AzureCloudMetadataProvider.GetMetadataAsync()
Elastic.Apm: Trace: {PayloadSenderV2} Unable to get azure-app-service cloud metadata as no WEBSITE_OWNER_NAME environment variable exists. The application is likely not running in azure-app-service
Elastic.Apm: Trace: {HttpDiagnosticListenerCoreImpl} Called with key: `System.Net.Http.HttpRequestOut.Start'
Elastic.Apm: Trace: {HttpDiagnosticListenerCoreImpl} Request URL (https://apm01:8200/) is filtered out - exiting
Elastic.Apm: Trace: {HttpDiagnosticListenerCoreImpl} Called with key: `System.Net.Http.Request'
Elastic.Apm: Trace: {HttpDiagnosticListenerCoreImpl} Request URL (https://apm01:8200/) is filtered out - exiting
Elastic.Apm: Trace: {HttpDiagnosticListenerCoreImpl} Called with key: `System.Net.Http.HttpRequestOut.Stop'
Elastic.Apm: Trace: {HttpDiagnosticListenerCoreImpl} Request URL (https://apm01:8200/) is filtered out - exiting
Elastic.Apm: Trace: {HttpDiagnosticListenerCoreImpl} Called with key: `System.Net.Http.Response'
Elastic.Apm: Trace: {HttpDiagnosticListenerCoreImpl} Event's Request property is null - exiting

Logs Continue....

Logs Continue....

1 Like

Logs Continuation...

Elastic.Apm: Trace: {CentralConfigurationFetcher} Reading HTTP response body... Response: StatusCode: 403, ReasonPhrase: 'Forbidden', Version: 1.1, Content: System.Net.Http.HttpConnectionResponseContent, Headers:
{
  X-Content-Type-Options: nosniff
  Date: Sun, 10 Jul 2022 19:59:10 GMT
  Content-Type: text/plain; charset=utf-8
  Content-Length: 309
}.
Elastic.Apm: Trace: {CentralConfigurationResponseParser} Processing HTTP response...
+-> Response:
    StatusCode: 403, ReasonPhrase: 'Forbidden', Version: 1.1, Content: System.Net.Http.HttpConnectionResponseContent, Headers:
    {
      X-Content-Type-Options: nosniff
      Date: Sun, 10 Jul 2022 19:59:10 GMT
      Content-Type: text/plain; charset=utf-8
      Content-Length: 309
    }
+-> Response body [length: 309]:
    {"error":"forbidden request: Agent remote configuration is disabled. Configure the `apm-server.kibana` section in apm-server.yml to enable it. If you are using a RUM agent, you also need to configure the `apm-server.rum` section. If you are not using remote configuration, you can safely ignore this error."}

Elastic.Apm: Debug: {CentralConfigurationFetcher} Exception was thrown while fetching configuration from APM Server and parsing it. ETag: `<null>'. URL: `https://apm01:8200/config/v1/agents?service.name=ElasticAPM-Postgresql-Sample&service.environment=Development'. Apm Server base URL: `https://apm01:8200/'. WaitInterval: 5m. dbgIterationsCount: 1.
+-> Request:
    Method: GET, RequestUri: 'https://apm01:8200/config/v1/agents?service.name=ElasticAPM-Postgresql-Sample&service.environment=Development', Version: 1.1, Content: <null>, Headers:
    {
      User-Agent: apm-agent-dotnet/1.16.1+896f164721034998eaae468029611a1195487013
      User-Agent: (ElasticAPM-Postgresql-Sample 1.0.0)
      User-Agent: System.Net.Http/6.0.622.26707
      User-Agent: .NET_6/6.0.6
    }
+-> Response:
    StatusCode: 403, ReasonPhrase: 'Forbidden', Version: 1.1, Content: System.Net.Http.HttpConnectionResponseContent, Headers:
    {
      X-Content-Type-Options: nosniff
      Date: Sun, 10 Jul 2022 19:59:10 GMT
      Content-Type: text/plain; charset=utf-8
      Content-Length: 309
    }
+-> Response body [length: 309]:
    {"error":"forbidden request: Agent remote configuration is disabled. Configure the `apm-server.kibana` section in apm-server.yml to enable it. If you are using a RUM agent, you also need to configure the `apm-server.rum` section. If you are not using remote configuration, you can safely ignore this error."}


Elastic.Apm.BackendComm.CentralConfig.CentralConfigurationFetcher+FailedToFetchConfigException: HTTP status code is Forbidden (403) which most likely means that APM Server supports the central configuration endpoint but Kibana connection is not enabled
   at Elastic.Apm.BackendComm.CentralConfig.CentralConfigurationResponseParser.InterpretResponseStatusCode(HttpResponseMessage httpResponse, WaitInfoS waitInfo)
   at Elastic.Apm.BackendComm.CentralConfig.CentralConfigurationResponseParser.ParseHttpResponse(HttpResponseMessage httpResponse, String httpResponseBody)
   at Elastic.Apm.BackendComm.CentralConfig.CentralConfigurationFetcher.WorkLoopIteration()
Elastic.Apm: Trace: {CentralConfigurationFetcher} Waiting 5m... Default wait time is used because there's no valid Cache-Control header with max-age directive in APM Server's response.
+-> Response:
    StatusCode: 403, ReasonPhrase: 'Forbidden', Version: 1.1, Content: System.Net.Http.HttpConnectionResponseContent, Headers:
    {
      X-Content-Type-Options: nosniff
      Date: Sun, 10 Jul 2022 19:59:10 GMT
      Content-Type: text/plain; charset=utf-8
      Content-Length: 309
    }. dbgIterationsCount: 1.
Microsoft.Hosting.Lifetime: Information: Now listening on: https://localhost:7112
Microsoft.Hosting.Lifetime: Information: Now listening on: http://localhost:5112
Microsoft.Hosting.Lifetime: Information: Application started. Press Ctrl+C to shut down.
Microsoft.Hosting.Lifetime: Information: Hosting environment: Development
Microsoft.Hosting.Lifetime: Information: Content root path: C:\Users\Renan\source\repos\ElasticAPM-Postgresql-sample\ElasticAPM-Postgresql-sample\
Elastic.Apm: Trace: {PayloadSenderV2} Waiting for data to send... FlushInterval: 10s
Elastic.Apm: Debug: {ApmMiddleware} Incoming request. Starting Trace.
Elastic.Apm: Debug: {AbstractConfigurationReader (MicrosoftExtensionsConfig)} Using provided transaction sample rate `1.0' parsed as 1
Elastic.Apm: Trace: {Transaction} New Transaction instance created: Transaction{Id: 96c5f2c4f2c79ec1, TraceId: 90a072fecb489466bb1836056212d6f5, ParentId: null, Name: GET /swagger/index.html, Type: request, Outcome: Unknown, IsSampled: True}. IsSampled (True) is based on the given sampler (Sampler{ constant: True }). Start time: 2022-07-10 19:59:11.2331490 UTC (as timestamp: 1657483151233149)
Elastic.Apm: Debug: {Tracer} Starting Transaction{Id: 96c5f2c4f2c79ec1, TraceId: 90a072fecb489466bb1836056212d6f5, ParentId: null, Name: GET /swagger/index.html, Type: request, Outcome: Unknown, IsSampled: True}
Elastic.Apm: Debug: {AbstractConfigurationReader (MicrosoftExtensionsConfig)} CaptureHeaders configuration option doesn't have a valid value - using default: True
Elastic.Apm: Trace: {ApmMiddleware} Filling transaction.Context.Response, StatusCode: 200
Elastic.Apm: Trace: {Transaction} Ended Transaction{Id: 96c5f2c4f2c79ec1, TraceId: 90a072fecb489466bb1836056212d6f5, ParentId: null, Name: GET /swagger/index.html, Type: request, Outcome: Success, IsSampled: True}. Start time: 2022-07-10 19:59:11.2331490 UTC (as timestamp: 1657483151233149), End time: 2022-07-10 19:59:11.4915590 UTC (as timestamp: 1657483151491559), Duration: 258.41ms
Elastic.Apm: Debug: {PayloadSenderV2} Enqueued Transaction. newEventQueueCount: 1. MaxQueueEventCount: 1000. Transaction: Transaction{Id: 96c5f2c4f2c79ec1, TraceId: 90a072fecb489466bb1836056212d6f5, ParentId: null, Name: GET /swagger/index.html, Type: request, Outcome: Success, IsSampled: True}.
Elastic.Apm: Debug: {ApmMiddleware} Incoming request. Starting Trace.
Elastic.Apm: Debug: {AbstractConfigurationReader (MicrosoftExtensionsConfig)} Using provided transaction sample rate `1.0' parsed as 1
Elastic.Apm: Trace: {Transaction} New Transaction instance created: Transaction{Id: c552651fbb4a3d22, TraceId: 0ae691025e55ee7f8ab0aaee69a41ad5, ParentId: null, Name: GET /swagger/v1/swagger.json, Type: request, Outcome: Unknown, IsSampled: True}. IsSampled (True) is based on the given sampler (Sampler{ constant: True }). Start time: 2022-07-10 19:59:11.6623480 UTC (as timestamp: 1657483151662348)
Elastic.Apm: Debug: {Tracer} Starting Transaction{Id: c552651fbb4a3d22, TraceId: 0ae691025e55ee7f8ab0aaee69a41ad5, ParentId: null, Name: GET /swagger/v1/swagger.json, Type: request, Outcome: Unknown, IsSampled: True}
Elastic.Apm: Debug: {AbstractConfigurationReader (MicrosoftExtensionsConfig)} CaptureHeaders configuration option doesn't have a valid value - using default: True
Elastic.Apm: Trace: {ApmMiddleware} Filling transaction.Context.Response, StatusCode: 200
Elastic.Apm: Trace: {Transaction} Ended Transaction{Id: c552651fbb4a3d22, TraceId: 0ae691025e55ee7f8ab0aaee69a41ad5, ParentId: null, Name: GET /swagger/v1/swagger.json, Type: request, Outcome: Success, IsSampled: True}. Start time: 2022-07-10 19:59:11.6623480 UTC (as timestamp: 1657483151662348), End time: 2022-07-10 19:59:11.7770650 UTC (as timestamp: 1657483151777065), Duration: 114.717ms
Elastic.Apm: Debug: {PayloadSenderV2} Enqueued Transaction. newEventQueueCount: 2. MaxQueueEventCount: 1000. Transaction: Transaction{Id: c552651fbb4a3d22, TraceId: 0ae691025e55ee7f8ab0aaee69a41ad5, ParentId: null, Name: GET /swagger/v1/swagger.json, Type: request, Outcome: Success, IsSampled: True}.
Elastic.Apm: Trace: {PayloadSenderV2} There's data to be sent. Batch size: 2. newEventQueueCount: 0. First event: Transaction{Id: 96c5f2c4f2c79ec1, TraceId: 90a072fecb489466bb1836056212d6f5, ParentId: null, Name: GET /swagger/index.html, Type: request, Outcome: Success, IsSampled: True}.
Elastic.Apm: Trace: {PayloadSenderV2} Start executing filter on transaction
Elastic.Apm: Trace: {PayloadSenderV2} Serialized item to send: Transaction{Id: 96c5f2c4f2c79ec1, TraceId: 90a072fecb489466bb1836056212d6f5, ParentId: null, Name: GET /swagger/index.html, Type: request, Outcome: Success, IsSampled: True} as {"context":{"request":{"body":"[REDACTED]","headers":{"Accept":"text/html,application/xhtml+xml,application/xml;q=0.9,image/avif,image/webp,image/apng,*/*;q=0.8,application/signed-exchange;v=b3;q=0.9","Host":"localhost:7112","User-Agent":"Mozilla/5.0 (Windows NT 10.0; Win64; x64) AppleWebKit/537.36 (KHTML, like Gecko) Chrome/103.0.0.0 Safari/537.36",":method":"GET","Accept-Encoding":"gzip, deflate, br","Accept-Language":"pt-BR,pt;q=0.9,en-US;q=0.8,en;q=0.7","Cookie":"_xsrf=2|d6d49756|280185215c1a99632206f348a5e93e26|1655567394,username-localhost-8888=\"2|1:0|10:1657287190|23:username-localhost-8888|44:YjUyYjIxYzgyYzE4NDNmNDkxMmQxNWFmZmNhNzJhMjI=|ed9402d0919b06456ee1daa24535b34fa46dd976ba702cd0c11e067ed2b3dc22\",username-localhost-8889=\"2|1:0|10:1657303335|23:username-localhost-8889|44:ZGRkNGQ4MzlhMGFmNDJhYTgyMTJmMWQyNGFhMzFmMWU=|40b2303471c5d51134c909e6f7acd7cfa0770857a92e577ff905c5743bb53fd5\"","Upgrade-Insecure-Requests":"1","sec-fetch-site":"none","sec-fetch-mode":"navigate","sec-fetch-user":"?1","sec-fetch-dest":"document","sec-ch-ua":"\".Not/A)Brand\";v=\"99\", \"Google Chrome\";v=\"103\", \"Chromium\";v=\"103\"","sec-ch-ua-mobile":"?0","sec-ch-ua-platform":"\"Windows\""},"http_version":"2","method":"GET","socket":{"remote_address":"::1"},"url":{"full":"https://localhost:7112/swagger/index.html","hostname":"localhost","pathname":"/swagger/index.html","protocol":"HTTP","raw":"https://localhost:7112/swagger/index.html","search":""}},"response":{"finished":true,"headers":{"Content-Type":"text/html;charset=utf-8","Date":"Sun, 10 Jul 2022 19:59:10 GMT","Server":"Kestrel"},"status_code":200}},"duration":258.41,"id":"96c5f2c4f2c79ec1","sampled":true,"name":"GET /swagger/index.html","outcome":"success","result":"HTTP 2xx","sample_rate":1.0,"span_count":{"dropped":0,"started":0},"timestamp":1657483151233149,"trace_id":"90a072fecb489466bb1836056212d6f5","type":"request"}
Elastic.Apm: Trace: {PayloadSenderV2} Start executing filter on transaction
Elastic.Apm: Trace: {PayloadSenderV2} Serialized item to send: Transaction{Id: c552651fbb4a3d22, TraceId: 0ae691025e55ee7f8ab0aaee69a41ad5, ParentId: null, Name: GET /swagger/v1/swagger.json, Type: request, Outcome: Success, IsSampled: True} as {"context":{"request":{"body":"[REDACTED]","headers":{"Accept":"application/json,*/*","Host":"localhost:7112","User-Agent":"Mozilla/5.0 (Windows NT 10.0; Win64; x64) AppleWebKit/537.36 (KHTML, like Gecko) Chrome/103.0.0.0 Safari/537.36",":method":"GET","Accept-Encoding":"gzip, deflate, br","Accept-Language":"pt-BR,pt;q=0.9,en-US;q=0.8,en;q=0.7","Cookie":"_xsrf=2|d6d49756|280185215c1a99632206f348a5e93e26|1655567394,username-localhost-8888=\"2|1:0|10:1657287190|23:username-localhost-8888|44:YjUyYjIxYzgyYzE4NDNmNDkxMmQxNWFmZmNhNzJhMjI=|ed9402d0919b06456ee1daa24535b34fa46dd976ba702cd0c11e067ed2b3dc22\",username-localhost-8889=\"2|1:0|10:1657303335|23:username-localhost-8889|44:ZGRkNGQ4MzlhMGFmNDJhYTgyMTJmMWQyNGFhMzFmMWU=|40b2303471c5d51134c909e6f7acd7cfa0770857a92e577ff905c5743bb53fd5\"","Referer":"https://localhost:7112/swagger/index.html","sec-ch-ua":"\".Not/A)Brand\";v=\"99\", \"Google Chrome\";v=\"103\", \"Chromium\";v=\"103\"","sec-ch-ua-mobile":"?0","sec-ch-ua-platform":"\"Windows\"","sec-fetch-site":"same-origin","sec-fetch-mode":"cors","sec-fetch-dest":"empty"},"http_version":"2","method":"GET","socket":{"remote_address":"::1"},"url":{"full":"https://localhost:7112/swagger/v1/swagger.json","hostname":"localhost","pathname":"/swagger/v1/swagger.json","protocol":"HTTP","raw":"https://localhost:7112/swagger/v1/swagger.json","search":""}},"response":{"finished":true,"headers":{"Content-Type":"application/json;charset=utf-8","Date":"Sun, 10 Jul 2022 19:59:11 GMT","Server":"Kestrel"},"status_code":200}},"duration":114.717,"id":"c552651fbb4a3d22","sampled":true,"name":"GET /swagger/v1/swagger.json","outcome":"success","result":"HTTP 2xx","sample_rate":1.0,"span_count":{"dropped":0,"started":0},"timestamp":1657483151662348,"trace_id":"0ae691025e55ee7f8ab0aaee69a41ad5","type":"request"}
Elastic.Apm: Trace: {HttpDiagnosticListenerCoreImpl} Called with key: `System.Net.Http.HttpRequestOut.Start'
Elastic.Apm: Trace: {HttpDiagnosticListenerCoreImpl} Request URL (https://apm01:8200/intake/v2/events) is filtered out - exiting
Elastic.Apm: Trace: {HttpDiagnosticListenerCoreImpl} Called with key: `System.Net.Http.Request'
Elastic.Apm: Trace: {HttpDiagnosticListenerCoreImpl} Request URL (https://apm01:8200/intake/v2/events) is filtered out - exiting
Elastic.Apm: Trace: {HttpDiagnosticListenerCoreImpl} Called with key: `System.Net.Http.HttpRequestOut.Stop'
Elastic.Apm: Trace: {HttpDiagnosticListenerCoreImpl} Request URL (https://apm01:8200/intake/v2/events) is filtered out - exiting
Elastic.Apm: Trace: {HttpDiagnosticListenerCoreImpl} Called with key: `System.Net.Http.Response'
Elastic.Apm: Trace: {HttpDiagnosticListenerCoreImpl} Event's Request property is null - exiting
Elastic.Apm: Debug: {PayloadSenderV2} Sent items to server:
    Transaction{Id: 96c5f2c4f2c79ec1, TraceId: 90a072fecb489466bb1836056212d6f5, ParentId: null, Name: GET /swagger/index.html, Type: request, Outcome: Success, IsSampled: True},
    Transaction{Id: c552651fbb4a3d22, TraceId: 0ae691025e55ee7f8ab0aaee69a41ad5, ParentId: null, Name: GET /swagger/v1/swagger.json, Type: request, Outcome: Success, IsSampled: True}
Elastic.Apm: Trace: {PayloadSenderV2} Waiting for data to send... FlushInterval: 10s
The thread 0x5468 has exited with code 0 (0x0).
Elastic.Apm: Debug: {ApmMiddleware} Incoming request. Starting Trace.
Elastic.Apm: Debug: {AbstractConfigurationReader (MicrosoftExtensionsConfig)} Using provided transaction sample rate `1.0' parsed as 1
Elastic.Apm: Trace: {Transaction} New Transaction instance created: Transaction{Id: a531000ece490014, TraceId: 808c2f86dc771bc70ef0196276f4fca5, ParentId: null, Name: GET /weatherforecast, Type: request, Outcome: Unknown, IsSampled: True}. IsSampled (True) is based on the given sampler (Sampler{ constant: True }). Start time: 2022-07-10 19:59:29.8813680 UTC (as timestamp: 1657483169881368)
Elastic.Apm: Debug: {Tracer} Starting Transaction{Id: a531000ece490014, TraceId: 808c2f86dc771bc70ef0196276f4fca5, ParentId: null, Name: GET /weatherforecast, Type: request, Outcome: Unknown, IsSampled: True}
Elastic.Apm: Debug: {AbstractConfigurationReader (MicrosoftExtensionsConfig)} CaptureHeaders configuration option doesn't have a valid value - using default: True
Elastic.Apm: Trace: {ApmMiddleware} Calculating transaction name based on route data
Elastic.Apm: Debug: {AbstractConfigurationReader (MicrosoftExtensionsConfig)} CaptureHeaders configuration option doesn't have a valid value - using default: True
Elastic.Apm: Trace: {ApmMiddleware} Filling transaction.Context.Response, StatusCode: 200
Elastic.Apm: Trace: {Transaction} Ended Transaction{Id: a531000ece490014, TraceId: 808c2f86dc771bc70ef0196276f4fca5, ParentId: null, Name: GET WeatherForecast/Get, Type: request, Outcome: Success, IsSampled: True}. Start time: 2022-07-10 19:59:29.8813680 UTC (as timestamp: 1657483169881368), End time: 2022-07-10 19:59:30.2976550 UTC (as timestamp: 1657483170297655), Duration: 416.287ms
Elastic.Apm: Debug: {PayloadSenderV2} Enqueued Transaction. newEventQueueCount: 1. MaxQueueEventCount: 1000. Transaction: Transaction{Id: a531000ece490014, TraceId: 808c2f86dc771bc70ef0196276f4fca5, ParentId: null, Name: GET WeatherForecast/Get, Type: request, Outcome: Success, IsSampled: True}.
The thread 0x64fc has exited with code 0 (0x0).
Elastic.Apm: Trace: {PayloadSenderV2} There's data to be sent. Batch size: 1. newEventQueueCount: 0. First event: Transaction{Id: a531000ece490014, TraceId: 808c2f86dc771bc70ef0196276f4fca5, ParentId: null, Name: GET WeatherForecast/Get, Type: request, Outcome: Success, IsSampled: True}.
Elastic.Apm: Trace: {PayloadSenderV2} Start executing filter on transaction
Elastic.Apm: Trace: {PayloadSenderV2} Serialized item to send: Transaction{Id: a531000ece490014, TraceId: 808c2f86dc771bc70ef0196276f4fca5, ParentId: null, Name: GET WeatherForecast/Get, Type: request, Outcome: Success, IsSampled: True} as {"context":{"request":{"body":"[REDACTED]","headers":{"Accept":"application/json","Connection":"keep-alive","Host":"localhost:7112","User-Agent":"PostmanRuntime/7.29.0","Accept-Encoding":"gzip, deflate, br","Postman-Token":"[REDACTED]"},"http_version":"1.1","method":"GET","socket":{"remote_address":"::1"},"url":{"full":"https://localhost:7112/weatherforecast","hostname":"localhost","pathname":"/weatherforecast","protocol":"HTTP","raw":"https://localhost:7112/weatherforecast","search":""}},"response":{"finished":true,"headers":{"Content-Type":"application/json; charset=utf-8","Date":"Sun, 10 Jul 2022 19:59:29 GMT","Server":"Kestrel","Transfer-Encoding":"chunked"},"status_code":200}},"duration":416.287,"id":"a531000ece490014","sampled":true,"name":"GET WeatherForecast/Get","outcome":"success","result":"HTTP 2xx","sample_rate":1.0,"span_count":{"dropped":0,"started":0},"timestamp":1657483169881368,"trace_id":"808c2f86dc771bc70ef0196276f4fca5","type":"request"}
Elastic.Apm: Trace: {HttpDiagnosticListenerCoreImpl} Called with key: `System.Net.Http.HttpRequestOut.Start'
Elastic.Apm: Trace: {HttpDiagnosticListenerCoreImpl} Request URL (https://apm01:8200/intake/v2/events) is filtered out - exiting
Elastic.Apm: Trace: {HttpDiagnosticListenerCoreImpl} Called with key: `System.Net.Http.Request'
Elastic.Apm: Trace: {HttpDiagnosticListenerCoreImpl} Request URL (https://apm01:8200/intake/v2/events) is filtered out - exiting
Elastic.Apm: Trace: {HttpDiagnosticListenerCoreImpl} Called with key: `System.Net.Http.HttpRequestOut.Stop'
Elastic.Apm: Trace: {HttpDiagnosticListenerCoreImpl} Request URL (https://apm01:8200/intake/v2/events) is filtered out - exiting
Elastic.Apm: Trace: {HttpDiagnosticListenerCoreImpl} Called with key: `System.Net.Http.Response'
Elastic.Apm: Trace: {HttpDiagnosticListenerCoreImpl} Event's Request property is null - exiting
Elastic.Apm: Debug: {PayloadSenderV2} Sent items to server:
    Transaction{Id: a531000ece490014, TraceId: 808c2f86dc771bc70ef0196276f4fca5, ParentId: null, Name: GET WeatherForecast/Get, Type: request, Outcome: Success, IsSampled: True}
Elastic.Apm: Trace: {PayloadSenderV2} Waiting for data to send... FlushInterval: 10s
The thread 0x7f0 has exited with code 0 (0x0).
Elastic.Apm: Trace: {MetricsCollector} CollectAllMetrics started
Elastic.Apm: Trace: {MetricsCollector} Start collecting BreakdownMetricsProvider
Elastic.Apm: Trace: {MetricsCollector} Collected BreakdownMetricsProvider - adding it to MetricSet
Elastic.Apm: Trace: {MetricsCollector} Start collecting process total CPU time
Elastic.Apm: Trace: {MetricsCollector} Collected process total CPU time - adding it to MetricSet
Elastic.Apm: Trace: {MetricsCollector} Start collecting total system CPU time
Elastic.Apm: Trace: {MetricsCollector} Collected total system CPU time - adding it to MetricSet
Elastic.Apm: Trace: {MetricsCollector} Start collecting process's working set and virtual memory size
Elastic.Apm: Trace: {MetricsCollector} Collected process's working set and virtual memory size - adding it to MetricSet
Elastic.Apm: Trace: {MetricsCollector} Start collecting total and free memory
Elastic.Apm: Trace: {MetricsCollector} Collected total and free memory - adding it to MetricSet
Elastic.Apm: Trace: {MetricsCollector} Skipping GcMetricsProvider - IsMetricAlreadyCaptured indicated false
Elastic.Apm: Trace: {MetricsCollector} Skipping CgroupMetricsProvider - IsMetricAlreadyCaptured indicated false
Elastic.Apm: Debug: {PayloadSenderV2} Enqueued MetricSet. newEventQueueCount: 1. MaxQueueEventCount: 1000. MetricSet: Elastic.Apm.Metrics.MetricSet.
Elastic.Apm: Debug: {PayloadSenderV2} Enqueued MetricSet. newEventQueueCount: 2. MaxQueueEventCount: 1000. MetricSet: Elastic.Apm.Metrics.MetricSet.
Elastic.Apm: Debug: {PayloadSenderV2} Enqueued MetricSet. newEventQueueCount: 3. MaxQueueEventCount: 1000. MetricSet: Elastic.Apm.Metrics.MetricSet.
Elastic.Apm: Debug: {PayloadSenderV2} Enqueued MetricSet. newEventQueueCount: 4. MaxQueueEventCount: 1000. MetricSet: Elastic.Apm.Metrics.MetricSet.
Elastic.Apm: Debug: {PayloadSenderV2} Enqueued MetricSet. newEventQueueCount: 5. MaxQueueEventCount: 1000. MetricSet: Elastic.Apm.Metrics.MetricSet.
Elastic.Apm: Debug: {PayloadSenderV2} Enqueued MetricSet. newEventQueueCount: 6. MaxQueueEventCount: 1000. MetricSet: Elastic.Apm.Metrics.MetricSet.
Elastic.Apm: Debug: {PayloadSenderV2} Enqueued MetricSet. newEventQueueCount: 7. MaxQueueEventCount: 1000. MetricSet: Elastic.Apm.Metrics.MetricSet.
Elastic.Apm: Debug: {MetricsCollector} Metrics collected: Elastic.Apm.Metrics.MetricSet, Elastic.Apm.Metrics.MetricSet, Elastic.Apm.Metrics.MetricSet, Elastic.Apm.Metrics.MetricSet, Elastic.Apm.Metrics.MetricSet, Elastic.Apm.Metrics.MetricSet, Elastic.Apm.Metrics.MetricSet
Elastic.Apm: Trace: {PayloadSenderV2} There's data to be sent. Batch size: 7. newEventQueueCount: 0. First event: Elastic.Apm.Metrics.MetricSet.
Elastic.Apm: Trace: {PayloadSenderV2} Serialized item to send: Elastic.Apm.Metrics.MetricSet as {"transaction":{"name":"GET /swagger/index.html","type":"request"},"span":{"type":"app","subtype":null},"samples":{"span.self_time.count":{"value":1.0},"span.self_time.sum.us":{"value":258410.00000000003}},"timestamp":1657483151499075}
Elastic.Apm: Trace: {PayloadSenderV2} Serialized item to send: Elastic.Apm.Metrics.MetricSet as {"transaction":{"name":"GET /swagger/v1/swagger.json","type":"request"},"span":{"type":"app","subtype":null},"samples":{"span.self_time.count":{"value":1.0},"span.self_time.sum.us":{"value":114717.0}},"timestamp":1657483151778816}
Elastic.Apm: Trace: {PayloadSenderV2} Serialized item to send: Elastic.Apm.Metrics.MetricSet as {"transaction":{"name":"GET WeatherForecast/Get","type":"request"},"span":{"type":"app","subtype":null},"samples":{"span.self_time.count":{"value":1.0},"span.self_time.sum.us":{"value":416287.0}},"timestamp":1657483170299443}
Elastic.Apm: Trace: {PayloadSenderV2} Serialized item to send: Elastic.Apm.Metrics.MetricSet as {"samples":{"system.process.cpu.total.norm.pct":{"value":0.007599987208948707}},"timestamp":1657483180057606}
Elastic.Apm: Trace: {PayloadSenderV2} Serialized item to send: Elastic.Apm.Metrics.MetricSet as {"samples":{"system.cpu.total.norm.pct":{"value":1.0}},"timestamp":1657483190767456}
Elastic.Apm: Trace: {PayloadSenderV2} Serialized item to send: Elastic.Apm.Metrics.MetricSet as {"samples":{"system.process.memory.size":{"value":2225351004160.0},"system.process.memory.rss.bytes":{"value":107130880.0}},"timestamp":1657483190785893}
Elastic.Apm: Trace: {PayloadSenderV2} Serialized item to send: Elastic.Apm.Metrics.MetricSet as {"samples":{"system.memory.actual.free":{"value":3645579264.0},"system.memory.total":{"value":17034276864.0}},"timestamp":1657483190791454}
Elastic.Apm: Trace: {HttpDiagnosticListenerCoreImpl} Called with key: `System.Net.Http.HttpRequestOut.Start'
Elastic.Apm: Trace: {HttpDiagnosticListenerCoreImpl} Request URL (https://apm01:8200/intake/v2/events) is filtered out - exiting
Elastic.Apm: Trace: {HttpDiagnosticListenerCoreImpl} Called with key: `System.Net.Http.Request'
Elastic.Apm: Trace: {HttpDiagnosticListenerCoreImpl} Request URL (https://apm01:8200/intake/v2/events) is filtered out - exiting
Elastic.Apm: Trace: {HttpDiagnosticListenerCoreImpl} Called with key: `System.Net.Http.HttpRequestOut.Stop'
Elastic.Apm: Trace: {HttpDiagnosticListenerCoreImpl} Request URL (https://apm01:8200/intake/v2/events) is filtered out - exiting
Elastic.Apm: Trace: {HttpDiagnosticListenerCoreImpl} Called with key: `System.Net.Http.Response'
Elastic.Apm: Trace: {HttpDiagnosticListenerCoreImpl} Event's Request property is null - exiting
Elastic.Apm: Debug: {PayloadSenderV2} Sent items to server:
    Elastic.Apm.Metrics.MetricSet,
    Elastic.Apm.Metrics.MetricSet,
    Elastic.Apm.Metrics.MetricSet,
    Elastic.Apm.Metrics.MetricSet,
    Elastic.Apm.Metrics.MetricSet,
    Elastic.Apm.Metrics.MetricSet,
    Elastic.Apm.Metrics.MetricSet
Elastic.Apm: Trace: {PayloadSenderV2} Waiting for data to send... FlushInterval: 10s
The thread 0x5d60 has exited with code 0 (0x0).
The thread 0x4908 has exited with code 0 (0x0).
Elastic.Apm: Trace: {MetricsCollector} CollectAllMetrics started
Elastic.Apm: Trace: {MetricsCollector} Skipping BreakdownMetricsProvider - IsMetricAlreadyCaptured indicated false
Elastic.Apm: Trace: {MetricsCollector} Start collecting process total CPU time
Elastic.Apm: Trace: {MetricsCollector} Collected process total CPU time - adding it to MetricSet
Elastic.Apm: Trace: {MetricsCollector} Start collecting total system CPU time
Elastic.Apm: Trace: {MetricsCollector} Collected total system CPU time - adding it to MetricSet
Elastic.Apm: Trace: {MetricsCollector} Start collecting process's working set and virtual memory size
Elastic.Apm: Trace: {MetricsCollector} Collected process's working set and virtual memory size - adding it to MetricSet
Elastic.Apm: Trace: {MetricsCollector} Start collecting total and free memory
Elastic.Apm: Trace: {MetricsCollector} Collected total and free memory - adding it to MetricSet
Elastic.Apm: Trace: {MetricsCollector} Skipping GcMetricsProvider - IsMetricAlreadyCaptured indicated false
Elastic.Apm: Trace: {MetricsCollector} Skipping CgroupMetricsProvider - IsMetricAlreadyCaptured indicated false
Elastic.Apm: Debug: {PayloadSenderV2} Enqueued MetricSet. newEventQueueCount: 1. MaxQueueEventCount: 1000. MetricSet: Elastic.Apm.Metrics.MetricSet.
Elastic.Apm: Debug: {PayloadSenderV2} Enqueued MetricSet. newEventQueueCount: 2. MaxQueueEventCount: 1000. MetricSet: Elastic.Apm.Metrics.MetricSet.
Elastic.Apm: Debug: {PayloadSenderV2} Enqueued MetricSet. newEventQueueCount: 3. MaxQueueEventCount: 1000. MetricSet: Elastic.Apm.Metrics.MetricSet.
Elastic.Apm: Debug: {PayloadSenderV2} Enqueued MetricSet. newEventQueueCount: 4. MaxQueueEventCount: 1000. MetricSet: Elastic.Apm.Metrics.MetricSet.
Elastic.Apm: Debug: {MetricsCollector} Metrics collected: Elastic.Apm.Metrics.MetricSet, Elastic.Apm.Metrics.MetricSet, Elastic.Apm.Metrics.MetricSet, Elastic.Apm.Metrics.MetricSet
The thread 0x5f40 has exited with code 0 (0x0).
Elastic.Apm: Trace: {PayloadSenderV2} There's data to be sent. Batch size: 4. newEventQueueCount: 0. First event: Elastic.Apm.Metrics.MetricSet.
Elastic.Apm: Trace: {PayloadSenderV2} Serialized item to send: Elastic.Apm.Metrics.MetricSet as {"samples":{"system.process.cpu.total.norm.pct":{"value":0.0017593465446261215}},"timestamp":1657483210031387}
Elastic.Apm: Trace: {PayloadSenderV2} Serialized item to send: Elastic.Apm.Metrics.MetricSet as {"samples":{"system.cpu.total.norm.pct":{"value":0.12722803115844727}},"timestamp":1657483210034299}
Elastic.Apm: Trace: {PayloadSenderV2} Serialized item to send: Elastic.Apm.Metrics.MetricSet as {"samples":{"system.process.memory.size":{"value":2225347821568.0},"system.process.memory.rss.bytes":{"value":106487808.0}},"timestamp":1657483210038758}
Elastic.Apm: Trace: {PayloadSenderV2} Serialized item to send: Elastic.Apm.Metrics.MetricSet as {"samples":{"system.memory.actual.free":{"value":3696193536.0},"system.memory.total":{"value":17034276864.0}},"timestamp":1657483210041766}
Elastic.Apm: Trace: {HttpDiagnosticListenerCoreImpl} Called with key: `System.Net.Http.HttpRequestOut.Start'
Elastic.Apm: Trace: {HttpDiagnosticListenerCoreImpl} Request URL (https://apm01:8200/intake/v2/events) is filtered out - exiting
Elastic.Apm: Trace: {HttpDiagnosticListenerCoreImpl} Called with key: `System.Net.Http.Request'
Elastic.Apm: Trace: {HttpDiagnosticListenerCoreImpl} Request URL (https://apm01:8200/intake/v2/events) is filtered out - exiting
Elastic.Apm: Trace: {HttpDiagnosticListenerCoreImpl} Called with key: `System.Net.Http.HttpRequestOut.Stop'
Elastic.Apm: Trace: {HttpDiagnosticListenerCoreImpl} Request URL (https://apm01:8200/intake/v2/events) is filtered out - exiting
Elastic.Apm: Trace: {HttpDiagnosticListenerCoreImpl} Called with key: `System.Net.Http.Response'
Elastic.Apm: Trace: {HttpDiagnosticListenerCoreImpl} Event's Request property is null - exiting
Elastic.Apm: Debug: {PayloadSenderV2} Sent items to server:
    Elastic.Apm.Metrics.MetricSet,
    Elastic.Apm.Metrics.MetricSet,
    Elastic.Apm.Metrics.MetricSet,
    Elastic.Apm.Metrics.MetricSet
Elastic.Apm: Trace: {PayloadSenderV2} Waiting for data to send... FlushInterval: 10s

Hi @renansph

Npgsql isn't supported by the Elastic.Apm.NetCoreAll package which you use in the sample.

Good new is: it's supported by the profiler based agent. Here is the docs for that: Profiler Auto instrumentation | APM .NET Agent Reference [1.12] | Elastic

We also have a list of supported technologies list. We also list in what setup we support the specific library. You can see that here: Supported technologies | APM .NET Agent Reference [1.12] | Elastic

1 Like

Hi @GregKalapos , thanks for your quick answer!
Omg it worked perfectly. I spent several days and could'nt figure it out. I'm just a lil confused, why it only work in profile instrumentation and not importing packages, but its ok.
It also worked for my .NET Framework app.

Thank you very much!

This topic was automatically closed 20 days after the last reply. New replies are no longer allowed.