Hey folks,
My company decided to start implementing "traces\spans" into our stack and we would like to implement observability over them if possible.
I'm using this docker compose to launch a somewhat working elk stack to be able to just view a working POC of the traces being viewed (this example won't be a production grade deployment that is to say)
-
docker compose file - ELK with fleet and elastic agent · GitHub
-
.env file for the docker compose - .env file for the docker compose of the ELK stack · GitHub
-
kibana.yml file which is mounted in kibana container - kibana configuration file used in the docker compose ELK stack · GitHub
-
python application dockerfile - The Python's dockerfile's which is used in the docker compose to test the traces · GitHub
-
python application code - Python application used to test APM tracing in elk · GitHub
-
python requirements.txt file - requirements file for the dockerfile of the python application to run · GitHub
This is the guide i used in-order to spin everything up and upbring the current half-working stack
The steps taken are these -
1.Running docker compose to bring up the stack
2.Setting up the output of the from the "fleet" settings mentioned in the guide i linked above in this stage "Reconfigure output, add certificate"
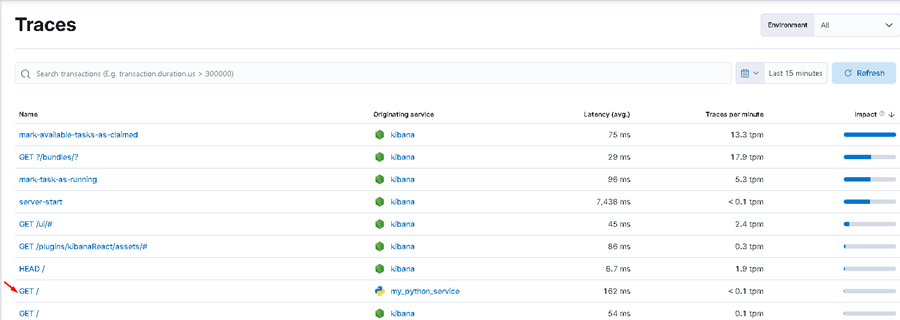
3.After doing so, i am able to some "Kibana" derived traces and information

4.Doing some calls to my python application that the docker compose runs
for example
command ->

curl -vv localhost:8000/

output ->

{"message":"Failed Successfully :)"}[
Then, when checking APM board in Kibana and see my trace
Now comes the issue, we have set up in an nginx-alpine-otel official image, which is configured to send traces into "otel collector",
which is running in from this docker image -
otel/opentelemetry-collector-contrib:0.120.0
And has this configuration file running with it otel collector configuration file · GitHub
(you will see in the configuration file some weird conventions for specifying ports in the configuration linked, u can assume it's static ports which are working, meaning - they receive traffic)
Now I am seeing in this otel collector, logs from nginx being received
for example:
And when I look at the elastic agent docker container logs, I do see the logs being received from the collector,
But again In the UI I do not see a service_named “Frontend-Gateway-linux-qa”
Like the span is sending, what am I missing ?
Would love and appreciate advise on this!
Thanks in advance guys