Thanks for the reply Andrew.
So I generated one trace with 3 spans. Two of these spans are generated by my code and the third one is generated by the ADO sql client. Here is the output logs:
2020-10-22T12:56:14.438571100Z  2020-10-22T12:56:14.438Z        INFO    loggingexporter/logging_exporter.go:296 TraceExporter   {"#spans": 3}
2020-10-22T12:56:14.438680900Z  2020-10-22T12:56:14.438Z        DEBUG   loggingexporter/logging_exporter.go:353 ResourceSpans #0
2020-10-22T12:56:14.438692100Z  Resource labels:
2020-10-22T12:56:14.438697400Z       -> service.name: STRING(Signaling)
2020-10-22T12:56:14.438701900Z  InstrumentationLibrarySpans #0
2020-10-22T12:56:14.438706100Z  InstrumentationLibrary OpenTelemetry.SqlClient 0.7.0.1
2020-10-22T12:56:14.438710300Z  Span #0
2020-10-22T12:56:14.438714400Z      Trace ID       : bd8bdf45b71114468c837eb08e103b5f
2020-10-22T12:56:14.438719000Z      Parent ID      : 8838a8c9a5f32b40
2020-10-22T12:56:14.438724200Z      ID             : 4293d407909bf949
2020-10-22T12:56:14.438731700Z      Name           : ReactsDBJoPro
2020-10-22T12:56:14.438739200Z      Kind           : SPAN_KIND_CLIENT
2020-10-22T12:56:14.438744800Z      Start time     : 2020-10-22 12:56:12.3998985 +0000 UTC
2020-10-22T12:56:14.438749800Z      End time       : 2020-10-22 12:56:12.4424377 +0000 UTC
2020-10-22T12:56:14.438754400Z      Status code    : STATUS_CODE_OK
2020-10-22T12:56:14.438758400Z      Status message :
2020-10-22T12:56:14.438762600Z  Attributes:
2020-10-22T12:56:14.438767300Z       -> db.system: STRING(mssql)
2020-10-22T12:56:14.438771600Z       -> db.name: STRING(ReactsDBJoPro)
2020-10-22T12:56:14.438775500Z       -> peer.service: STRING(local-sqlserver.iit-dev.com)
2020-10-22T12:56:14.438779500Z       -> db.statement_type: STRING(Text)
2020-10-22T12:56:14.438783500Z  InstrumentationLibrarySpans #1
2020-10-22T12:56:14.438787600Z  InstrumentationLibrary IIT.Reacts.Server
2020-10-22T12:56:14.438791900Z  Span #0
2020-10-22T12:56:14.438795700Z      Trace ID       : bd8bdf45b71114468c837eb08e103b5f
2020-10-22T12:56:14.438800100Z      Parent ID      : e4cad928df714d4a
2020-10-22T12:56:14.438804800Z      ID             : 8838a8c9a5f32b40
2020-10-22T12:56:14.438813700Z      Name           : BunnyQueryService process
2020-10-22T12:56:14.438832000Z      Kind           : SPAN_KIND_SERVER
2020-10-22T12:56:14.438836800Z      Start time     : 2020-10-22 12:56:12.3759984 +0000 UTC
2020-10-22T12:56:14.438841200Z      End time       : 2020-10-22 12:56:12.5095763 +0000 UTC
2020-10-22T12:56:14.438845500Z  Attributes:
2020-10-22T12:56:14.438849700Z       -> messaging.protocol: STRING(bunny)
2020-10-22T12:56:14.438853900Z       -> enduser.id: STRING(QueryChatMessagesRequest)
2020-10-22T12:56:14.438858500Z       -> span.id: STRING(8838a8c9a5f32b40)
2020-10-22T12:56:14.438862700Z       -> parent.id: STRING(e4cad928df714d4a)
2020-10-22T12:56:14.438867000Z       -> trace.id: STRING(bd8bdf45b71114468c837eb08e103b5f)
2020-10-22T12:56:14.438871200Z  Span #1
2020-10-22T12:56:14.438875300Z      Trace ID       : bd8bdf45b71114468c837eb08e103b5f
2020-10-22T12:56:14.438879500Z      Parent ID      :
2020-10-22T12:56:14.438883500Z      ID             : e4cad928df714d4a
2020-10-22T12:56:14.438889500Z      Name           : QueryChatMessagesRequest receive
2020-10-22T12:56:14.438894400Z      Kind           : SPAN_KIND_SERVER
2020-10-22T12:56:14.438898700Z      Start time     : 2020-10-22 12:56:12.3759381 +0000 UTC
2020-10-22T12:56:14.438903200Z      End time       : 2020-10-22 12:56:12.509584 +0000 UTC
2020-10-22T12:56:14.438907700Z  Attributes:
2020-10-22T12:56:14.438911900Z       -> messaging.protocol: STRING(bunny)
2020-10-22T12:56:14.438916100Z       -> enduser.id: STRING(7a4149da-8cd2-4fa2-a8bb-038413faed98)
2020-10-22T12:56:14.438923900Z       -> span.id: STRING(e4cad928df714d4a)
2020-10-22T12:56:14.438929900Z       -> parent.id: STRING(0000000000000000)
2020-10-22T12:56:14.438935900Z       -> trace.id: STRING(bd8bdf45b71114468c837eb08e103b5f)
2020-10-22T12:56:14.438943200Z
Here is the output in Jaeger:

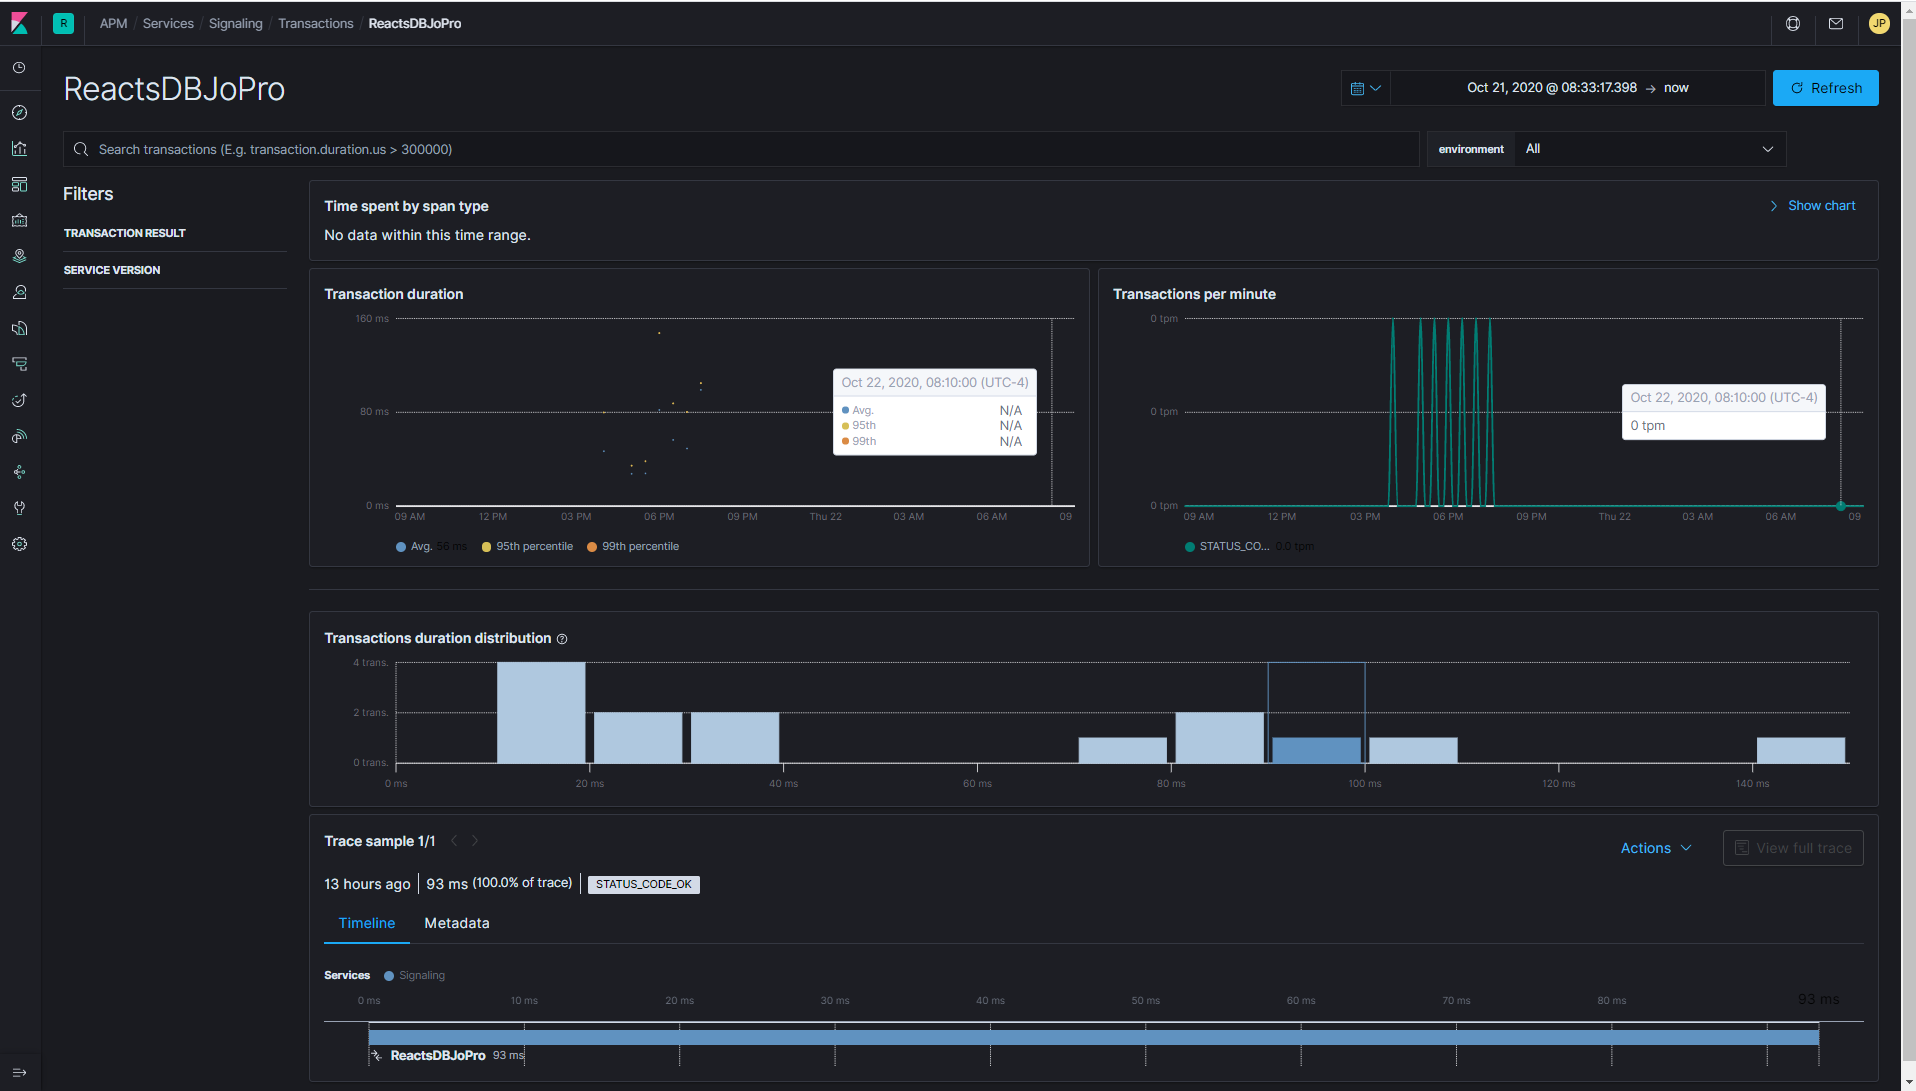
This morning, I don't see any data in the APM when I run my test. The screenshot includes yesterday as well to show you that I had some data yesterday with same config. The ReactsDBJoPro transaction you see is the name of the database that I am accessing. The span is generated by the ADO sql client and is not the root of the trace.

This is the details of the transaction ReactsDBJoPro:
And here is my config of the Collector if it can help:
receivers:
  otlp:
    protocols:
        grpc:

exporters:
  elastic:
    apm_server_url: [APM url found in APM Setup Instructions]
    secret_token: [APM token found in APM Setup Instructions]

  logging:
    loglevel: debug

  zipkin:
    endpoint: "http://zipkin-all-in-one:9411/api/v2/spans"
    format: proto

  jaeger:
    endpoint: jaeger-all-in-one:14250
    insecure: true

processors:
  batch:
  queued_retry:

extensions:
  health_check:
  pprof:
    endpoint: :1888
  zpages:
    endpoint: :55679

service:
  extensions: [pprof, zpages, health_check]
  pipelines:
    traces:
      receivers: [otlp]
      processors: [batch, queued_retry]
      exporters: [logging, elastic, jaeger]
Please note that I tried to set an invalid APM url to validate that the Collector output would show errors and I see the following output when doing so. (These logs do not appear when I put a valid APM url).
2020-10-22T13:23:07.240359100Z  {"level":"warn","ts":1603372987.2401333,"caller":"queuedprocessor/queued_processor.go:332","msg":"Backing off before next attempt","component_kind":"processor","component_type":"queued_retry","component_name":"queued_retry","backoff_delay":5}
2020-10-22T13:23:07.293471100Z  {"level":"info","ts":1603372987.29315,"caller":"queuedprocessor/queued_processor.go:338","msg":"Resume processing","component_kind":"processor","component_type":"queued_retry","component_name":"queued_retry"}
2020-10-22T13:23:07.428963400Z  {"level":"warn","ts":1603372987.4286866,"caller":"queuedprocessor/queued_processor.go:332","msg":"Backing off before next attempt","component_kind":"processor","component_type":"queued_retry","component_name":"queued_retry","backoff_delay":5}
- Is there anything that I can add to debug?
- Can we see the actual data sent to the APM by the elastic exporter?
- I have access to the Elastic Cloud dashboard and can modify its config if necessary.