OpenTelemetry integration issue with APM

Installation: Elastic cloud v7.6.1
Details

  • APM service is activated
  • OpenTelemetry Collector is running on docker using image: otel/opentelemetry-collector-contrib-dev:latest
  • I am using OpenTelemetry .NET SDK version 0.7.0-beta.1
  • OpenTelemetry SDK is configured to output directly to Collector through the OtlpExporter
  • Collector 's Exporters configuration seems ok since I receive all data in Jaeger and Zipkin. In APM I receive only partial data.

Issue
In my .Net Core application, I create Activities through ActivitySource.StartActivity(...). I am not using directly the Elastic .Net APM Agent.

I confirmed that with a Collector configured to export to Jaeger and ZipKin, I can see the resulting Traces/Spans correctly.

With an elastic exporter in the Collector, I can see that some data is added in the APM without any warning or errors in Collector's logs. But only specific spans are added to APM as "transactions". These spans are generated by the the sql client instrumentation in .Net. I believe that they are considered transactions in APM because they contains a transaction.id field.

All my other spans are not found in the APM. If I look in the apm-7.6.1-span-* indices, they do no contain any document.

Questions
Is the Collector supposed to map the fields generated by OpenTelemetry/.Net to a format supported by the APM? For example, to be considered a span in APM, do we need specific field present? If yes, is there some sort of mapping happening in the elastic exporter in the Collector that should add the correct fields?

Is the Collector supposed to map the fields generated by OpenTelemetry/.Net to a format supported by the APM? For example, to be considered a span in APM, do we need specific field present? If yes, is there some sort of mapping happening in the elastic exporter in the Collector that should add the correct fields?

Yes, the elastic exporter performs some translation between the OpenTelemetry semantic conventions and the Elastic APM data model. Most of the relevant bits are in https://github.com/open-telemetry/opentelemetry-collector-contrib/blob/master/exporter/elasticexporter/internal/translator/elastic/traces.go.

To debug this issue, could you please help us out by hooking up the logging exporter to the traces pipeline in your opentelemetry-collector config. After you've done that: trigger a request/trace, and capture the log output. If you can also identify which span(s) are in the logs that don't make their way into Elastic APM that would be ideal, and should help us figure out what's special about them.

If you could also provide a screenshot of the traces in Jaeger or Zipkin side-by-side with Elastic APM, that might also be helpful.

Thanks for reporting the problem!

Thanks for the reply Andrew.

So I generated one trace with 3 spans. Two of these spans are generated by my code and the third one is generated by the ADO sql client. Here is the output logs:

2020-10-22T12:56:14.438571100Z  2020-10-22T12:56:14.438Z        INFO    loggingexporter/logging_exporter.go:296 TraceExporter   {"#spans": 3}
2020-10-22T12:56:14.438680900Z  2020-10-22T12:56:14.438Z        DEBUG   loggingexporter/logging_exporter.go:353 ResourceSpans #0
2020-10-22T12:56:14.438692100Z  Resource labels:
2020-10-22T12:56:14.438697400Z       -> service.name: STRING(Signaling)
2020-10-22T12:56:14.438701900Z  InstrumentationLibrarySpans #0
2020-10-22T12:56:14.438706100Z  InstrumentationLibrary OpenTelemetry.SqlClient 0.7.0.1
2020-10-22T12:56:14.438710300Z  Span #0
2020-10-22T12:56:14.438714400Z      Trace ID       : bd8bdf45b71114468c837eb08e103b5f
2020-10-22T12:56:14.438719000Z      Parent ID      : 8838a8c9a5f32b40
2020-10-22T12:56:14.438724200Z      ID             : 4293d407909bf949
2020-10-22T12:56:14.438731700Z      Name           : ReactsDBJoPro
2020-10-22T12:56:14.438739200Z      Kind           : SPAN_KIND_CLIENT
2020-10-22T12:56:14.438744800Z      Start time     : 2020-10-22 12:56:12.3998985 +0000 UTC
2020-10-22T12:56:14.438749800Z      End time       : 2020-10-22 12:56:12.4424377 +0000 UTC
2020-10-22T12:56:14.438754400Z      Status code    : STATUS_CODE_OK
2020-10-22T12:56:14.438758400Z      Status message :
2020-10-22T12:56:14.438762600Z  Attributes:
2020-10-22T12:56:14.438767300Z       -> db.system: STRING(mssql)
2020-10-22T12:56:14.438771600Z       -> db.name: STRING(ReactsDBJoPro)
2020-10-22T12:56:14.438775500Z       -> peer.service: STRING(local-sqlserver.iit-dev.com)
2020-10-22T12:56:14.438779500Z       -> db.statement_type: STRING(Text)
2020-10-22T12:56:14.438783500Z  InstrumentationLibrarySpans #1
2020-10-22T12:56:14.438787600Z  InstrumentationLibrary IIT.Reacts.Server
2020-10-22T12:56:14.438791900Z  Span #0
2020-10-22T12:56:14.438795700Z      Trace ID       : bd8bdf45b71114468c837eb08e103b5f
2020-10-22T12:56:14.438800100Z      Parent ID      : e4cad928df714d4a
2020-10-22T12:56:14.438804800Z      ID             : 8838a8c9a5f32b40
2020-10-22T12:56:14.438813700Z      Name           : BunnyQueryService process
2020-10-22T12:56:14.438832000Z      Kind           : SPAN_KIND_SERVER
2020-10-22T12:56:14.438836800Z      Start time     : 2020-10-22 12:56:12.3759984 +0000 UTC
2020-10-22T12:56:14.438841200Z      End time       : 2020-10-22 12:56:12.5095763 +0000 UTC
2020-10-22T12:56:14.438845500Z  Attributes:
2020-10-22T12:56:14.438849700Z       -> messaging.protocol: STRING(bunny)
2020-10-22T12:56:14.438853900Z       -> enduser.id: STRING(QueryChatMessagesRequest)
2020-10-22T12:56:14.438858500Z       -> span.id: STRING(8838a8c9a5f32b40)
2020-10-22T12:56:14.438862700Z       -> parent.id: STRING(e4cad928df714d4a)
2020-10-22T12:56:14.438867000Z       -> trace.id: STRING(bd8bdf45b71114468c837eb08e103b5f)
2020-10-22T12:56:14.438871200Z  Span #1
2020-10-22T12:56:14.438875300Z      Trace ID       : bd8bdf45b71114468c837eb08e103b5f
2020-10-22T12:56:14.438879500Z      Parent ID      :
2020-10-22T12:56:14.438883500Z      ID             : e4cad928df714d4a
2020-10-22T12:56:14.438889500Z      Name           : QueryChatMessagesRequest receive
2020-10-22T12:56:14.438894400Z      Kind           : SPAN_KIND_SERVER
2020-10-22T12:56:14.438898700Z      Start time     : 2020-10-22 12:56:12.3759381 +0000 UTC
2020-10-22T12:56:14.438903200Z      End time       : 2020-10-22 12:56:12.509584 +0000 UTC
2020-10-22T12:56:14.438907700Z  Attributes:
2020-10-22T12:56:14.438911900Z       -> messaging.protocol: STRING(bunny)
2020-10-22T12:56:14.438916100Z       -> enduser.id: STRING(7a4149da-8cd2-4fa2-a8bb-038413faed98)
2020-10-22T12:56:14.438923900Z       -> span.id: STRING(e4cad928df714d4a)
2020-10-22T12:56:14.438929900Z       -> parent.id: STRING(0000000000000000)
2020-10-22T12:56:14.438935900Z       -> trace.id: STRING(bd8bdf45b71114468c837eb08e103b5f)
2020-10-22T12:56:14.438943200Z 

Here is the output in Jaeger:

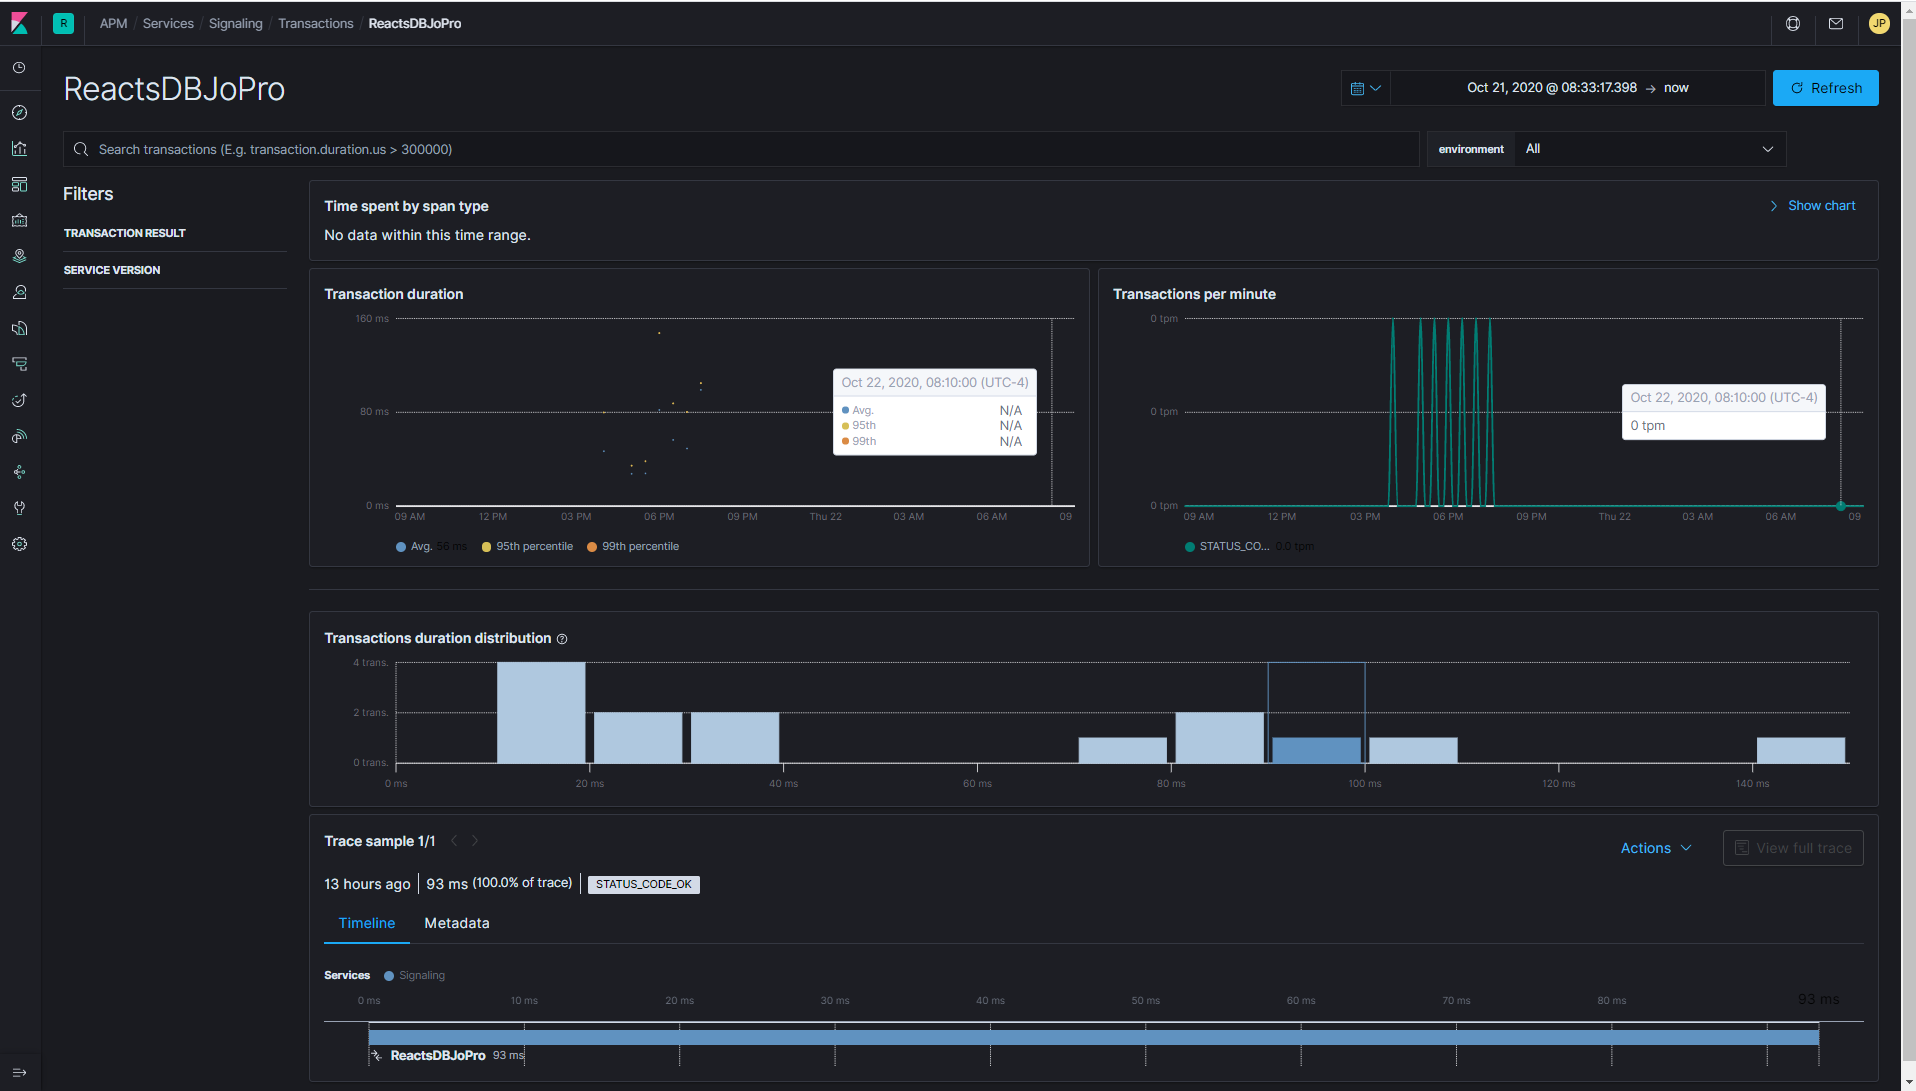
This morning, I don't see any data in the APM when I run my test. The screenshot includes yesterday as well to show you that I had some data yesterday with same config. The ReactsDBJoPro transaction you see is the name of the database that I am accessing. The span is generated by the ADO sql client and is not the root of the trace.

This is the details of the transaction ReactsDBJoPro:

And here is my config of the Collector if it can help:

receivers:
  otlp:
    protocols:
        grpc:

exporters:
  elastic:
    apm_server_url: [APM url found in APM Setup Instructions]
    secret_token: [APM token found in APM Setup Instructions]
    
  logging:
    loglevel: debug
 
  zipkin:
    endpoint: "http://zipkin-all-in-one:9411/api/v2/spans"
    format: proto

  jaeger:
    endpoint: jaeger-all-in-one:14250
    insecure: true

processors:
  batch:
  queued_retry:
 
extensions:
  health_check:
  pprof:
    endpoint: :1888
  zpages:
    endpoint: :55679

service:
  extensions: [pprof, zpages, health_check]
  pipelines:
    traces:
      receivers: [otlp]
      processors: [batch, queued_retry]
      exporters: [logging, elastic, jaeger]

Please note that I tried to set an invalid APM url to validate that the Collector output would show errors and I see the following output when doing so. (These logs do not appear when I put a valid APM url).

2020-10-22T13:23:07.240359100Z  {"level":"warn","ts":1603372987.2401333,"caller":"queuedprocessor/queued_processor.go:332","msg":"Backing off before next attempt","component_kind":"processor","component_type":"queued_retry","component_name":"queued_retry","backoff_delay":5}
2020-10-22T13:23:07.293471100Z  {"level":"info","ts":1603372987.29315,"caller":"queuedprocessor/queued_processor.go:338","msg":"Resume processing","component_kind":"processor","component_type":"queued_retry","component_name":"queued_retry"}
2020-10-22T13:23:07.428963400Z  {"level":"warn","ts":1603372987.4286866,"caller":"queuedprocessor/queued_processor.go:332","msg":"Backing off before next attempt","component_kind":"processor","component_type":"queued_retry","component_name":"queued_retry","backoff_delay":5}
  • Is there anything that I can add to debug?
  • Can we see the actual data sent to the APM by the elastic exporter?
  • I have access to the Elastic Cloud dashboard and can modify its config if necessary.
1 Like

Thanks for sending all that through. I'll keep digging, but I don't see anything obvious yet. It's concerning that you were seeing data in Elastic APM and now you're not.

You can pass --log-level=DEBUG to opentelemetry-collector, which will cause all payloads send to Elastic APM Server to be logged. This might at least help to confirm that data is being sent. Any errors occurring in the exporter should be visible in zpages, which I see you have enabled.

Thanks, I'll try that. I'll try also to run a local ELK stack on my machine to see if I can reproduce the same behavior. It is gonna be easier to get some logs. I'll post any findings.

If this is helpful for anyone, I opened a support ticket and they found errors in APM cluster logs :

Failed to publish events: 400 Bad Request: {"error":{"root_cause":[{"type":"illegal_argument_exception","reason":"no write index is defined for alias [apm-7.6.1-span]. The write index may be explicitly disabled using is_write_index=false or the alias points to multiple indices without one being designated as a write index"}],"type":"illegal_argument_exception","reason":"no write index is defined for alias [apm-7.6.1-span]. The write index may be explicitly disabled using is_write_index=false or the alias points to multiple indices without one being designated as a write index"},"status":400}

By setting a write index as described here, it solved the issue:

Apologies for not mentioning it, but there was a manual deletion of a span index and manual recreation of the index and that seemed to have triggered the issue where the write index was not set correctly. I had tested it on a local setup and the index was recreated automatically, so I didn't make the link between the two events.

Is there a way to see the APM cluster logs from the cloud Elastic dashboard or from Kibana?

Thanks for your time Andrew.

Apologies for not mentioning it, but there was a manual deletion of a span index and manual recreation of the index and that seemed to have triggered the issue where the write index was not set correctly. I had tested it on a local setup and the index was recreated automatically, so I didn't make the link between the two events.

No worries! We have some changes planned that will get rid of this issue by making use of a new Elasticsearch feature called "data streams". That doesn't help you now at all, I just wanted to say we're aware of this problem and working on addressing it.

Is there a way to see the APM cluster logs from the cloud Elastic dashboard or from Kibana?

As of a couple of weeks ago, you can configure your cloud deployment to ship logs to either the same or a dedicated monitoring/logging deployment. Check out the blog announcing this for details: Monitor and Manage Elasticsearch | Elastic

1 Like

This topic was automatically closed 20 days after the last reply. New replies are no longer allowed.