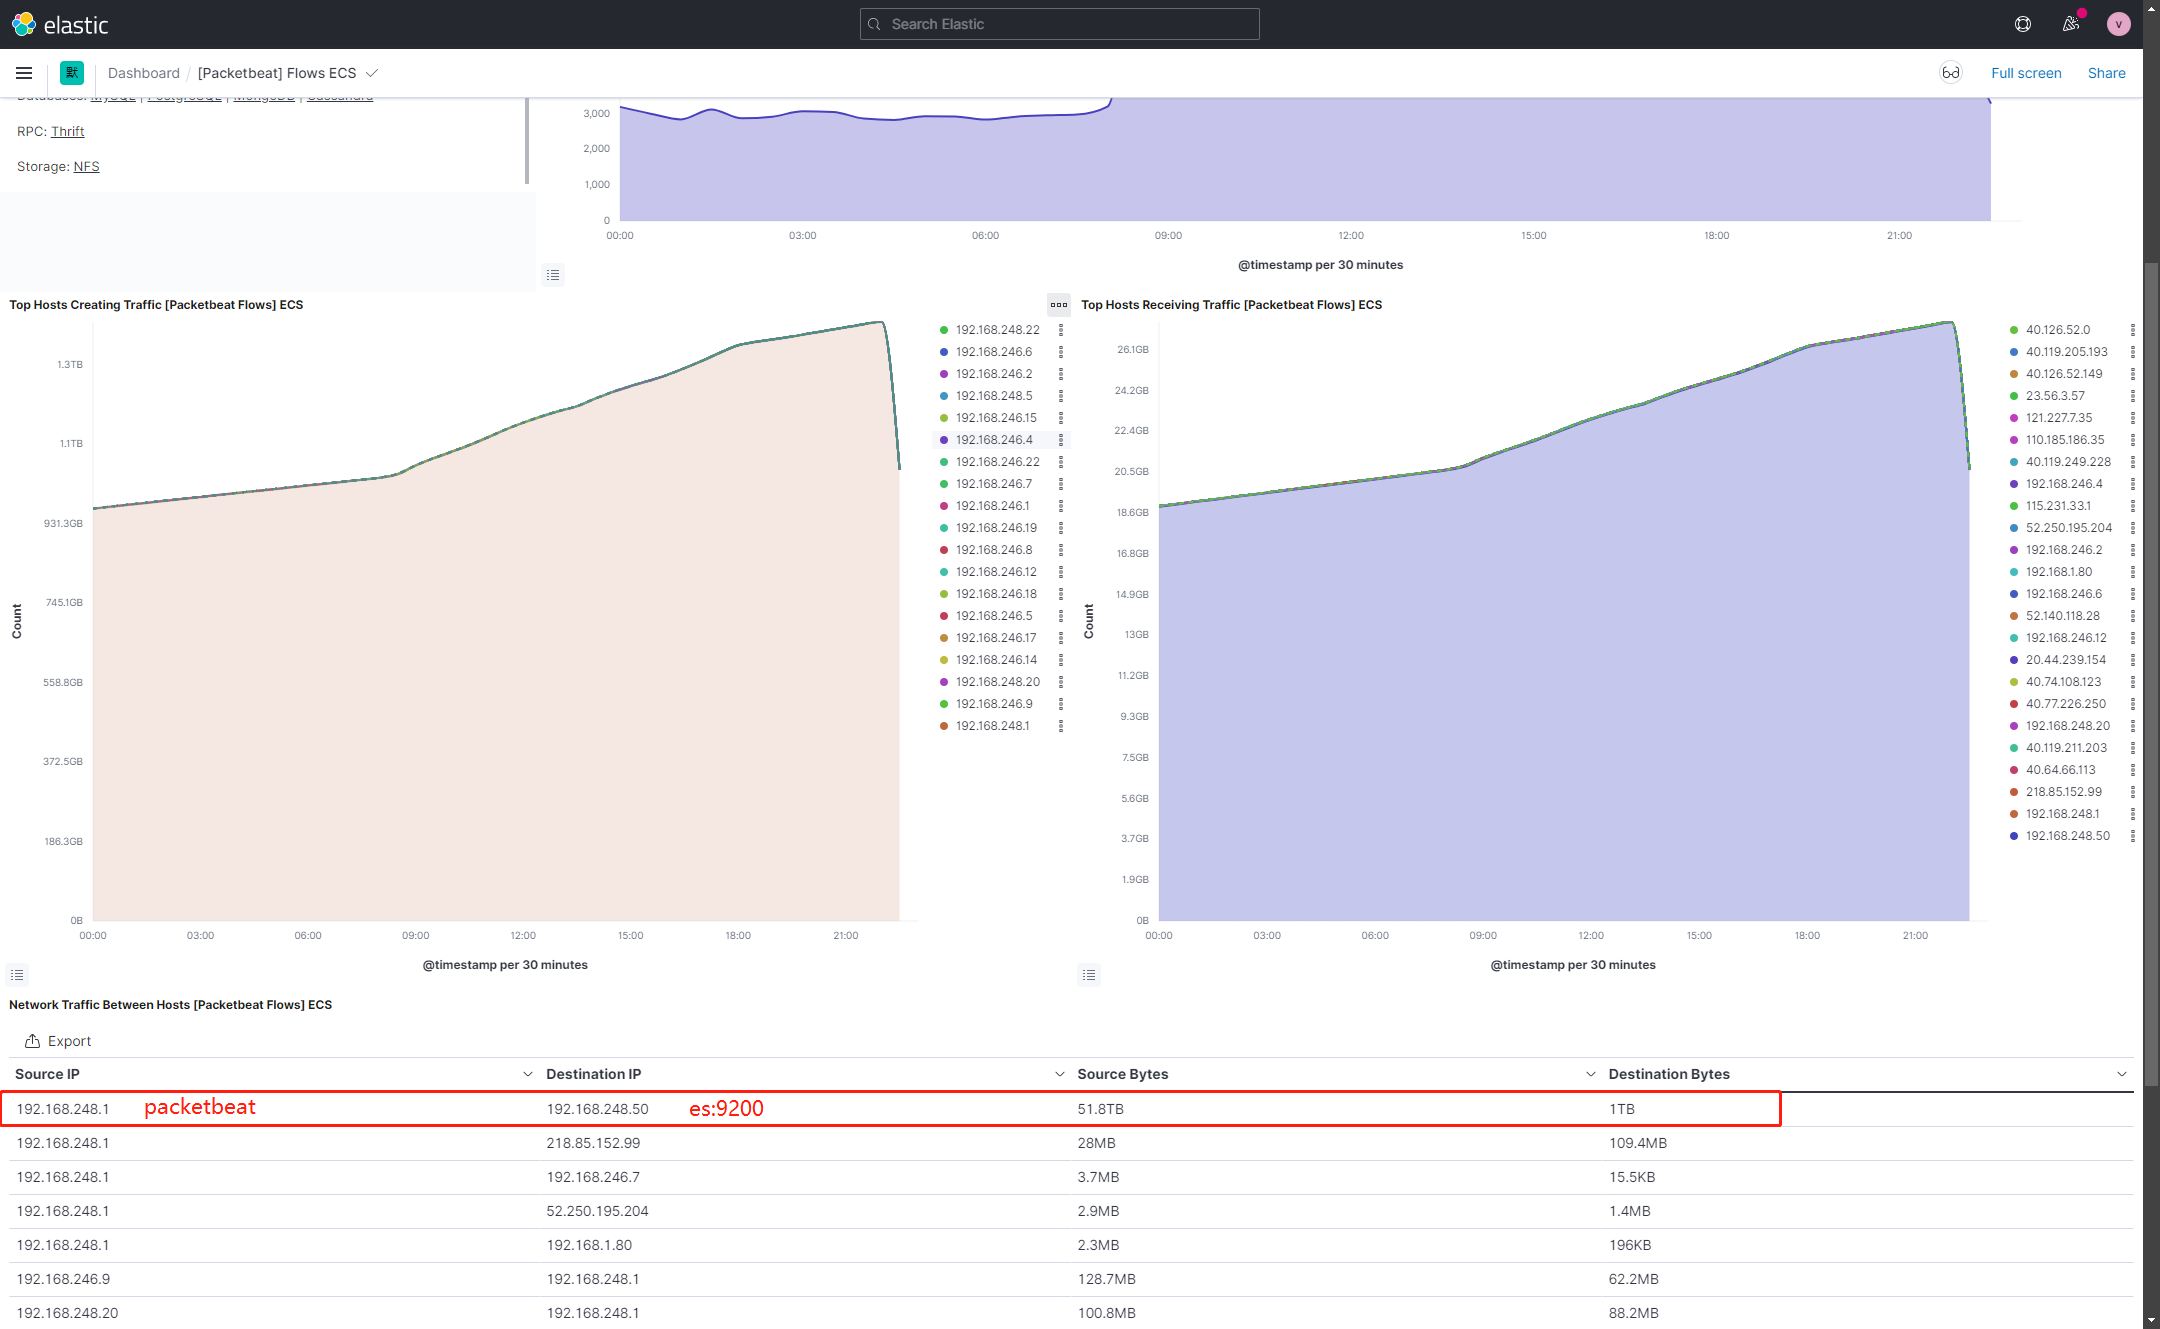
How does packetbeat filter its own data packets sent to es, because the server itself sends data to es:9200 in the collected data.
How to filter the information in this part.
Could anyone help me answer, thank you .
Hey @luweijun,
I am not sure of understanding your question, could you share your configuration and an example document that you want to filter out?
Would the drop_event processor help in your case?

Umm, this event should be filtered out with this processor. Could you share the whole configuration to double-check if there is some issue?

The attachment is the modified configuration file, but I still receive destination.port: 9200 .

The following is the packetbeat.yml configuration file
#################### Packetbeat Configuration Example #########################

# This file is an example configuration file highlighting only the most common
# options. The packetbeat.reference.yml file from the same directory contains all the
# supported options with more comments. You can use it as a reference.
#
# You can find the full configuration reference here:
# https://www.elastic.co/guide/en/beats/packetbeat/index.html

# =============================== Network device ===============================

# Select the network interface to sniff the data. On Linux, you can use the
# "any" keyword to sniff on all connected interfaces.
packetbeat.interfaces.device: 0

# The network CIDR blocks that are considered "internal" networks for
# the purpose of network perimeter boundary classification. The valid
# values for internal_networks are the same as those that can be used
# with processor network conditions.
#
# For a list of available values see:
# https://www.elastic.co/guide/en/beats/packetbeat/current/defining-processors.html#condition-network
packetbeat.interfaces.internal_networks:
  - private

# =================================== Flows ====================================

# Set `enabled: false` or comment out all options to disable flows reporting.
packetbeat.flows:
  # Set network flow timeout. Flow is killed if no packet is received before being
  # timed out.
  timeout: 30s

  # Configure reporting period. If set to -1, only killed flows will be reported
  period: 10s

# =========================== Transaction protocols ============================

packetbeat.protocols:
- type: icmp
  # Enable ICMPv4 and ICMPv6 monitoring. The default is true.
  enabled: true

- type: amqp
  # Configure the ports where to listen for AMQP traffic. You can disable
  # the AMQP protocol by commenting out the list of ports.
  ports: [5672]

- type: cassandra
  # Configure the ports where to listen for Cassandra traffic. You can disable
  # the Cassandra protocol by commenting out the list of ports.
  ports: [9042]

- type: dhcpv4
  # Configure the DHCP for IPv4 ports.
  ports: [67, 68]

- type: dns
  # Configure the ports where to listen for DNS traffic. You can disable
  # the DNS protocol by commenting out the list of ports.
  ports: [53]

- type: http
  # Configure the ports where to listen for HTTP traffic. You can disable
  # the HTTP protocol by commenting out the list of ports.
  ports: [80, 8080, 8000, 5000, 8002]

- type: memcache
  # Configure the ports where to listen for memcache traffic. You can disable
  # the Memcache protocol by commenting out the list of ports.
  ports: [11211]

- type: mysql
  # Configure the ports where to listen for MySQL traffic. You can disable
  # the MySQL protocol by commenting out the list of ports.
  ports: [3306,3307]

- type: pgsql
  # Configure the ports where to listen for Pgsql traffic. You can disable
  # the Pgsql protocol by commenting out the list of ports.
  ports: [5432]

- type: redis
  # Configure the ports where to listen for Redis traffic. You can disable
  # the Redis protocol by commenting out the list of ports.
  ports: [6379]

- type: thrift
  # Configure the ports where to listen for Thrift-RPC traffic. You can disable
  # the Thrift-RPC protocol by commenting out the list of ports.
  ports: [9090]

- type: mongodb
  # Configure the ports where to listen for MongoDB traffic. You can disable
  # the MongoDB protocol by commenting out the list of ports.
  ports: [27017]

- type: nfs
  # Configure the ports where to listen for NFS traffic. You can disable
  # the NFS protocol by commenting out the list of ports.
  ports: [2049]

- type: tls
  # Configure the ports where to listen for TLS traffic. You can disable
  # the TLS protocol by commenting out the list of ports.
  ports:
    - 443   # HTTPS
    - 993   # IMAPS
    - 995   # POP3S
    - 5223  # XMPP over SSL
    - 8443
    - 8883  # Secure MQTT
    - 9243  # Elasticsearch

- type: sip
  # Configure the ports where to listen for SIP traffic. You can disable
  # the SIP protocol by commenting out the list of ports.
  ports: [5060]

# ======================= Elasticsearch template setting =======================

setup.template.name: "packetbeat-%{[agent.version]}"
setup.template.pattern: "packetbeat-%{[agent.version]}-*"

setup.template.settings:
  index.number_of_shards: 1
  index.number_of_replicas: 0
  #index.codec: best_compression
  #_source.enabled: false

setup.ilm.enabled: false

# ================================== General ===================================

# The name of the shipper that publishes the network data. It can be used to group
# all the transactions sent by a single shipper in the web interface.
#name:

# A list of tags to include in every event. In the default configuration file
# the forwarded tag causes Packetbeat to not add any host fields. If you are
# monitoring a network tap or mirror port then add the forwarded tag.
#tags: [forwarded]
tags: ["MSAD", "DNS"]

# Optional fields that you can specify to add additional information to the
# output.
#fields:
#  env: staging

processors:
  - drop_event:
    when:
      equals:
        destination.port: 9200

# ================================= Dashboards =================================
# These settings control loading the sample dashboards to the Kibana index. Loading
# the dashboards is disabled by default and can be enabled either by setting the
# options here or by using the `setup` command.
#setup.dashboards.enabled: false

# The URL from where to download the dashboards archive. By default this URL
# has a value which is computed based on the Beat name and version. For released
# versions, this URL points to the dashboard archive on the artifacts.elastic.co
# website.
#setup.dashboards.url:

# =================================== Kibana ===================================

# Starting with Beats version 6.0.0, the dashboards are loaded via the Kibana API.
# This requires a Kibana endpoint configuration.
setup.kibana:

  # Kibana Host
  # Scheme and port can be left out and will be set to the default (http and 5601)
  # In case you specify and additional path, the scheme is required: http://localhost:5601/path
  # IPv6 addresses should always be defined as: https://[2001:db8::1]:5601
  #host: "localhost:5601"
  host: "192.168.248.50:5601"

  # Kibana Space ID
  # ID of the Kibana Space into which the dashboards should be loaded. By default,
  # the Default Space will be used.
  #space.id:

# =============================== Elastic Cloud ================================

# These settings simplify using Packetbeat with the Elastic Cloud (https://cloud.elastic.co/).

# The cloud.id setting overwrites the `output.elasticsearch.hosts` and
# `setup.kibana.host` options.
# You can find the `cloud.id` in the Elastic Cloud web UI.
#cloud.id:

# The cloud.auth setting overwrites the `output.elasticsearch.username` and
# `output.elasticsearch.password` settings. The format is `<user>:<pass>`.
#cloud.auth:

# ================================== Outputs ===================================

# Configure what output to use when sending the data collected by the beat.

# ---------------------------- Elasticsearch Output ----------------------------
output.elasticsearch:
  # Array of hosts to connect to.
  hosts: ["192.168.248.50:9200"]

  # Protocol - either `http` (default) or `https`.
  #protocol: "https"

  # Authentication credentials - either API key or username/password.
  #api_key: "id:api_key"
  #username: "elastic"
  #password: "changeme"
  username: "elastic"
  password: "219CZ38L0MU9NcHkxZB0"
  index: "packetbeat-%{[agent.version]}-msad-%{+yyyy.MM.dd}"

# ------------------------------ Logstash Output -------------------------------
#output.logstash:
  # The Logstash hosts
  #hosts: ["localhost:5044"]

  # Optional SSL. By default is off.
  # List of root certificates for HTTPS server verifications
  #ssl.certificate_authorities: ["/etc/pki/root/ca.pem"]

  # Certificate for SSL client authentication
  #ssl.certificate: "/etc/pki/client/cert.pem"

  # Client Certificate Key
  #ssl.key: "/etc/pki/client/cert.key"

# ================================= Processors =================================

processors:
  - # Add forwarded to tags when processing data from a network tap or mirror.
    if.contains.tags: forwarded
    then:
      - drop_fields:
          fields: [host]
    else:
      - add_host_metadata: ~
  - add_cloud_metadata: ~
  - add_docker_metadata: ~
  - detect_mime_type:
      field: http.request.body.content
      target: http.request.mime_type
  - detect_mime_type:
      field: http.response.body.content
      target: http.response.mime_type

# ================================== Logging ===================================

# Sets log level. The default log level is info.
# Available log levels are: error, warning, info, debug
#logging.level: debug

# At debug level, you can selectively enable logging only for some components.
# To enable all selectors use ["*"]. Examples of other selectors are "beat",
# "publisher", "service".
#logging.selectors: ["*"]

# ============================= X-Pack Monitoring ==============================
# Packetbeat can export internal metrics to a central Elasticsearch monitoring
# cluster.  This requires xpack monitoring to be enabled in Elasticsearch.  The
# reporting is disabled by default.

# Set to true to enable the monitoring reporter.
#monitoring.enabled: false

# Sets the UUID of the Elasticsearch cluster under which monitoring data for this
# Packetbeat instance will appear in the Stack Monitoring UI. If output.elasticsearch
# is enabled, the UUID is derived from the Elasticsearch cluster referenced by output.elasticsearch.
#monitoring.cluster_uuid:

# Uncomment to send the metrics to Elasticsearch. Most settings from the
# Elasticsearch output are accepted here as well.
# Note that the settings should point to your Elasticsearch *monitoring* cluster.
# Any setting that is not set is automatically inherited from the Elasticsearch
# output configuration, so if you have the Elasticsearch output configured such
# that it is pointing to your Elasticsearch monitoring cluster, you can simply
# uncomment the following line.
#monitoring.elasticsearch:

# ============================== Instrumentation ===============================

# Instrumentation support for the packetbeat.
#instrumentation:
    # Set to true to enable instrumentation of packetbeat.
    #enabled: false

    # Environment in which packetbeat is running on (eg: staging, production, etc.)
    #environment: ""

    # APM Server hosts to report instrumentation results to.
    #hosts:
    #  - http://localhost:8200

    # API Key for the APM Server(s).
    # If api_key is set then secret_token will be ignored.
    #api_key:

    # Secret token for the APM Server(s).
    #secret_token:


# ================================= Migration ==================================

# This allows to enable 6.7 migration aliases
#migration.6_to_7.enabled: true
Please help me thanks .
Umm, I think there is a missing indentation level here, I think it should be like this:
processors:
  - drop_event:
    when:
      equals:
        destination.port: 9200
In any case, a drop without condition should be dropping everything ![]() unless packetbeat is ignoring this config, do you see anything related on startup logs?
unless packetbeat is ignoring this config, do you see anything related on startup logs?
According to the indentation configuration you provided, it still doesn't work .
Wait. I have just seen that you have two processors: blocks, one is probably overriding the other, could you try to place all the processors inside the same block?
When I use the following configuration, the packetbeat service cannot be started .
processors:
  - # Add forwarded to tags when processing data from a network tap or mirror.
    if.contains.tags: forwarded
    then:
      - drop_fields:
          fields: [host]
    else:
      - add_host_metadata: ~
  - add_cloud_metadata: ~
  - add_docker_metadata: ~
  - detect_mime_type:
      field: http.request.body.content
      target: http.request.mime_type
  - detect_mime_type:
      field: http.response.body.content
      target: http.response.mime_type

  - drop_event:
      when:
        equals:
          destination.port: 9200
Does it show any error?