Hello,
I have a problem were my dashboard showing an "error" message when data are loaded from logstash, but if i load data directly from packetbeat to elastic cloud everything is working
This is my setup:
packetbeat.yml:
packetbeat.interfaces.device: any
packetbeat.interfaces.buffer_size_mb: 100
packetbeat.interfaces.internal_networks:
private
packetbeat.flows:
timeout: 30s
period: 10s
packetbeat.protocols:type: icmp
enabled: true
type: dhcpv4
ports: [67, 68]type: dns
ports: [53]type: http
ports: [80, 8080]type: tls
ports:
- 443
output.logstash:
hosts: ["x.io:5044"]
ssl.certificate_authorities: ["/etc/packetbeat/ca.crt"]
processors:- if.contains.tags: forwarded
then:
- drop_fields:
fields: [host]
else:- add_host_metadata: ~
- add_cloud_metadata: ~
- add_docker_metadata: ~
- detect_mime_type:
field: http.request.body.content
target: http.request.mime_type- detect_mime_type:
field: http.response.body.content
target: http.response.mime_type
setup.kibana:
logstash.conf:
input {
beats {
port => 5044
ssl => true
ecs_compatibility => "v8"
ssl_certificate => "/etc/ssl/logstash/ca.crt"
ssl_key => "/etc/ssl/logstash/x.key"
ssl_verify_mode => "none"
}
}filter {
}output {
elasticsearch {
cloud_id => "x"
cloud_auth => "x"
index => "%{[@metadata][beat]}-%{[@metadata][version]}-%{+YYYY.MM.dd}"
template => "/usr/share/logstash/config/packetbeat.template.json"
template_name => "packetbeat-8.0.0"
template_overwrite => true
}
}
To get the json template, i exported it from packetbeat with export command
I also run the command:
packetbeat -e setup --index-management -E output.logstash.enabled=false -E cloud.id="x" -E cloud.auth="x"
And add the dashboards:
packetbeat -e setup --dashboards -E output.logstash.enabled=false -E cloud.id="x" -E cloud.auth="x"
Now, if i go to kibana, my Indices are showing up:

My index templates is set:
Data are showing up under "packetbeat-*"
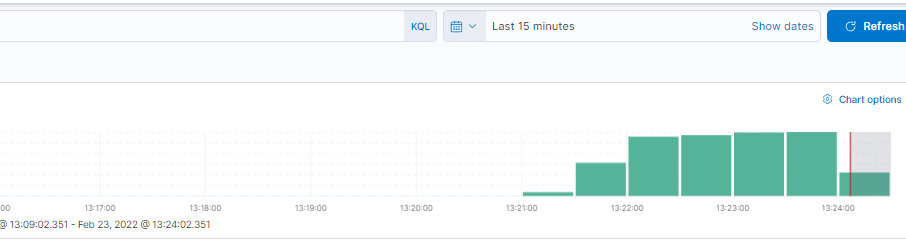
Data are OK:

But if i go to the dashboards, i see:

If i check the Index patterns, i only have 293 fields:

Now, if i try to change the output on packetbeat.yml to Elactic cloud instead of logstash and delete the old indices generated by logstash, all my dashboard are showing up and working, i also see more than 1000 fields inside the index pattern 'packetbeat-*'
I don't understand why i see this error as i think i followed correctly the how-to.
Thanks you very much if you can help