Palo Alto Firewall Log Collection Issue with Elasticsearch

Hello everyone,

I'm having a problem collecting logs from my Palo Alto firewall to my Elastic stack (Elasticsearch, Logstash, Kibana).

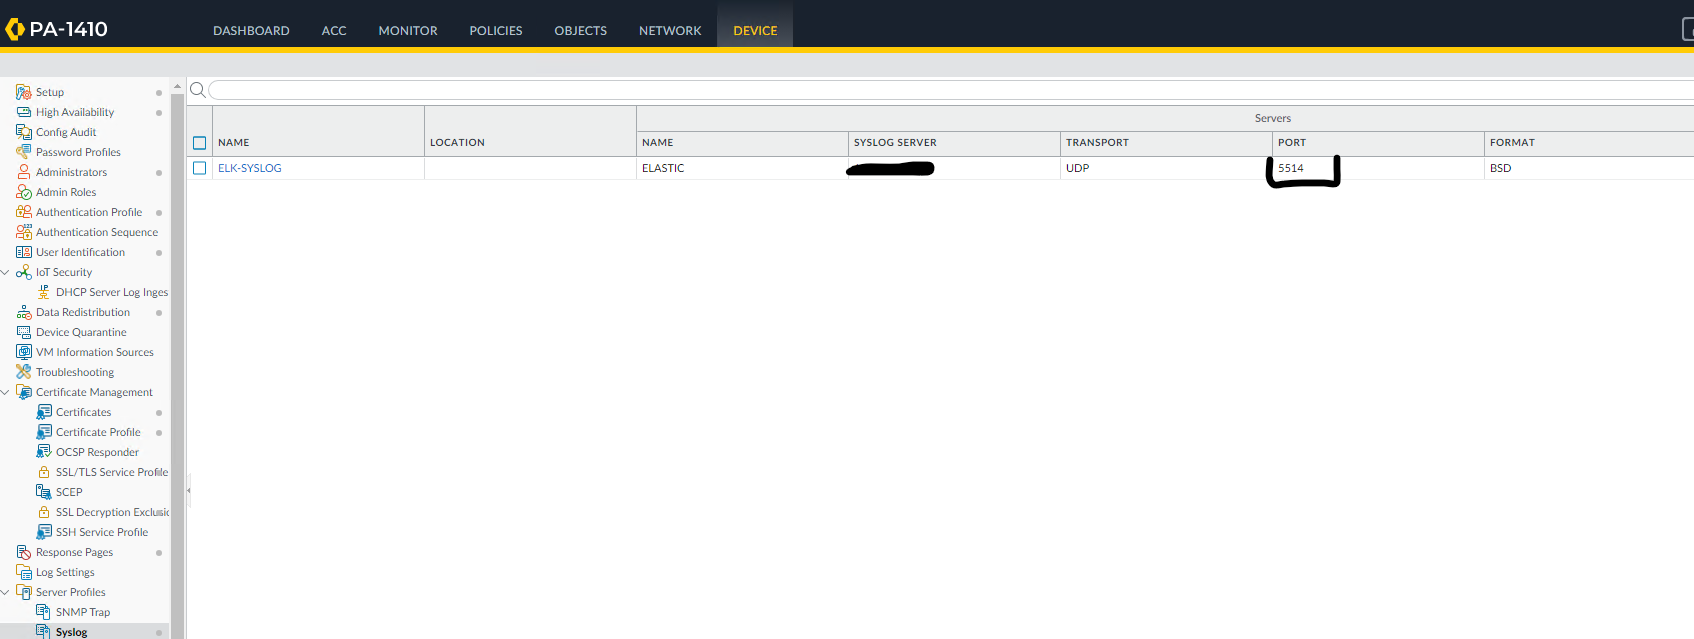
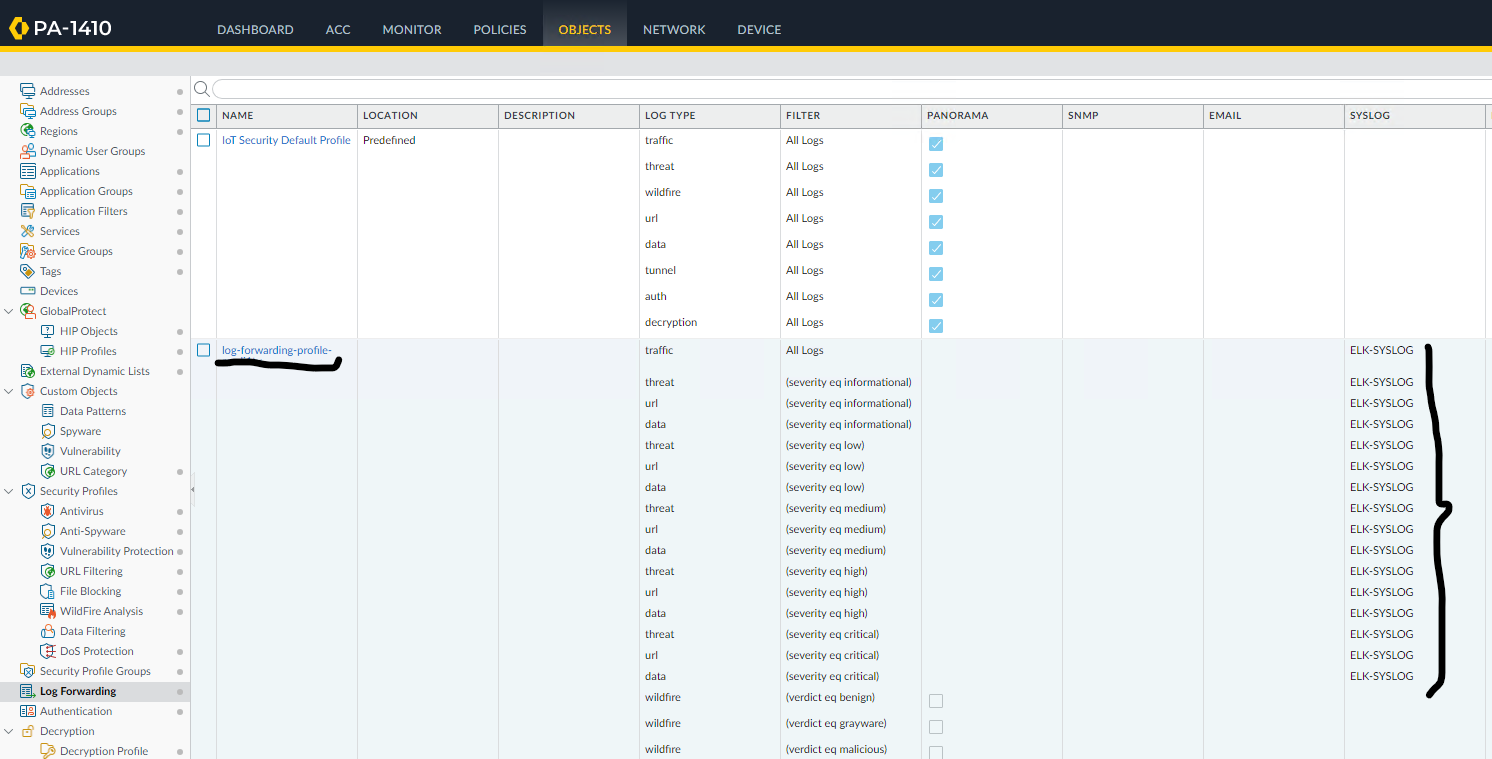
I configured the Palo Alto firewall to send logs in Syslog format to Logstash (see image 1).
I configured the /etc/logstash/conf.d/pa.conf file on the elastic server in the following form to retrieve the logs : input {
udp {
port => 514
type => "paloalto"
}
}

filter {
if [type] == "paloalto" {
grok {
match => { "message" => "%{SYSLOGTIMESTAMP:timestamp} %{HOSTNAME:firewall} %{DATA:process}: %{GREEDYDATA:log_message}" }
}
date {
match => [ "timestamp", "MMM dd HH:mm:ss" ]
target => "@timestamp"
}
}
}

output {
if [type] == "paloalto" {
elasticsearch {
hosts => ["A.B.C.D:9200"]
index => "paloalto-logs-%{+YYYY.MM.dd}"
}
}
}
The ports are open, but despite this, no Palo Alto logs appear in Elasticsearch/Kibana. Thanks in advance for your help!

First, Tcpdump or something to see if you are getting traffic on that port.

1 Like

You should check approximately in next order:

  1. Because the port 514 has bas been used, you must start LS with the root privileges. Make sure that LS is started, check LS logs, should be a message like listener started at port 514.
    [2025-04-20T16:00:53,772][INFO ][logstash.inputs.udp ][ls][01827e1d3bc64f8c9fed9dd2744e51e871712acd830c9e4cae89f984d16f99ba] Starting UDP listener {:address=>"0.0.0.0:514"}
    Also check network connections:
    netstat -lnpu
    or
    ss -uap

  2. Check firewall rules, have you applied correctly, both the network and the local firewall.
    iptable -S or ufw status or track logs

  3. Simplify pa.conf, keep input as it is, comment/remove everything from filter and add debug in the output

output {
 stdout {codec => rubydebug}
}
  1. Use TCPview to track UDP traffic. Set eth. adapter eth0 according your system.
    tcpdump -i eth0 udp port 514 -vv -X

  2. When you receive data, return the filter code backup

1 Like

Thanks for your replies, I changed the port 514 to 5514, and it works. I tested with the command echo "test log" | nc -u 0.0.0.0 5514 and I received (see image) :

1 Like

What is the perfect configuration that I can configure on the /etc/logstash/conf.d/pa.conf file to collect traffic logs from the Palo Alto firewall ?


?

The first you should receive a test message from PA as a raw formatted event. Then you can parse by grok, dissect or json. There is also syslog input plugin with cef codec

Look at the Elastic Agent, I think this is a supplied integration.

It may also be supplied in beats.

Yes, it's possible to use the EA which is a slightly different approach, with everything out-of-box, including data parsing and the dashboard. It depends on the case will be used LS or EA.

The problem I have is that the port configured on logstash and on palo alto is open and listening as you see in the image, even though I have configured the syslog on the firewall, but I do not receive any traffic log from the firewall:
Capture d’écran 2025-04-23 075306


You have the log forwarding, that's file. If you are not receiving data, check the local firewall on the LS host and the network firewall or in the data path.

Hi,

Thank you for your responses. I am now receiving logs from the Palo Alto firewall — it was a routing issue.

As you can see in the image, there's a sample of a Palo Alto log that contains two fields: "event.original" and "message", both with the same log content.

So ideally, I would like to keep only one of them — either remove event.original and keep message, or the other way around.

I’ve configured my /etc/logstash/conf.d/pa.conf file with remove field, but the event.original field is still present :
input {
udp {
port => 5514
type => "paloalto"
}
}

filter {
if [type] == "paloalto" {
grok {
match => { "message" => "%{SYSLOGTIMESTAMP:timestamp} %{HOSTNAME:firewall} %{DATA:process}: %{GREEDYDATA:log_message}" }
}
date {
match => [ "timestamp", "MMM dd HH:mm:ss" ]
target => "@timestamp"
}
mutate {
remove_field => ["event.original"]
}
}
}

output {
if [type] == "paloalto" {
elasticsearch {
hosts => ["192.168.41.230:9200"]
index => "paloalto-logs-%{+YYYY.MM.dd}"
}
}
}

Change this to remove_field => [ "[event][original]" ].

logstash can distinguish between fields with . in the name and nested fields, so { "a.b": 0 } would be [a.b], and { "a": { "b": 0 } } would be [a][b].

1 Like

Thank you for your help, it worked.

Now, after that, is it possible to parse the text found in the "message" field:
<166>May 22 10:19:46 FW1-1410-MEDI1TV-TANGER 1,2025/05/22 10:19:46,026709006463,TRAFFIC,end,2817,2025/05/22 10:19:46,192.168.83.111,20.42.73.29,197.230.74.238,20.42.73.29,navigation lan_83 by group,medi1tv\a.sokrat,,ssl,vsys1,inside,outside,ethernet1/8,ethernet1/12,log-forwarding-profile-medi1tv,2025/05/22 10:19:46,321922,1,62040,443,12357,443,0x140401c,tcp,allow,5745,781,4964,14,2025/05/22 10:19:31,0,any,,7495539264598377358,0x0,192.168.0.0-192.168.255.255,United States,,7,7,decrypt-cert-validation,0,0,0,0,,FW1-1410-MEDI1TV-TANGER,from-policy,,,0,,0,,N/A,0,0,0,0,3a57953a-e9bd-41c9-88f7-5e48cedeedab,0,0,,,,,,,,,,,,,,,,,,,,,,,,,,,,,,,,,,,2025-05-22T10:19:46.496+01:00,,,encrypted-tunnel,networking,browser-based,4,"used-by-malware,able-to-transfer-file,has-known-vulnerability,tunnel-other-application,pervasive-use",,ssl,no,no,0,NonProxyTraffic,

Into separate fields such as:

  • Receive Time: May 22 10:19:46
  • Type: end
  • From Zone: inside
  • To Zone: outside
  • Source IP: 192.168.83.111
  • Source User: medi1tv\a.sokrat
  • Destination: 20.42.73.29
  • To Port: 443
  • Application: SSL
  • Action: Allow
  • Rule: navigation lan_83 by group

[message] is basically a syslog message. Try parsing it using a syslog filter (or dissect) and use a csv filter to extract all the fields.

1 Like