Hi there,
It seems when utilising createErrorFromThrowable the exception itself is being registered in ElasticAPM which is great.
However, its missing the stack trace.
I can see that other transactions have a trace sample attached (which means the Agent is registered correctly), but when it comes to capturing errors it is missing.
Any idea how i can enhance my observability to support the stack trace when capturing errors manually?
Try using Elastic\Apm\ElasticApm::captureThrowable($e) instead of createErrorFromThrowable($e), and set elastic_apm.stack_trace_limit = -1 in your agent config. Restart PHP after the change and check if the stack trace appears in the error document.
Got it in that case you can stick with createErrorFromThrowable($e) but make sure you send it with ElasticApm::captureError() or attach it to a transaction/span.
Also check your config:
elastic_apm.stack_trace_limit = -1
Without that, the agent won’t include the stack trace even if the error is captured.
What’s your PHP agent version? Some older builds didn’t include full stack traces with createErrorFromThrowable.
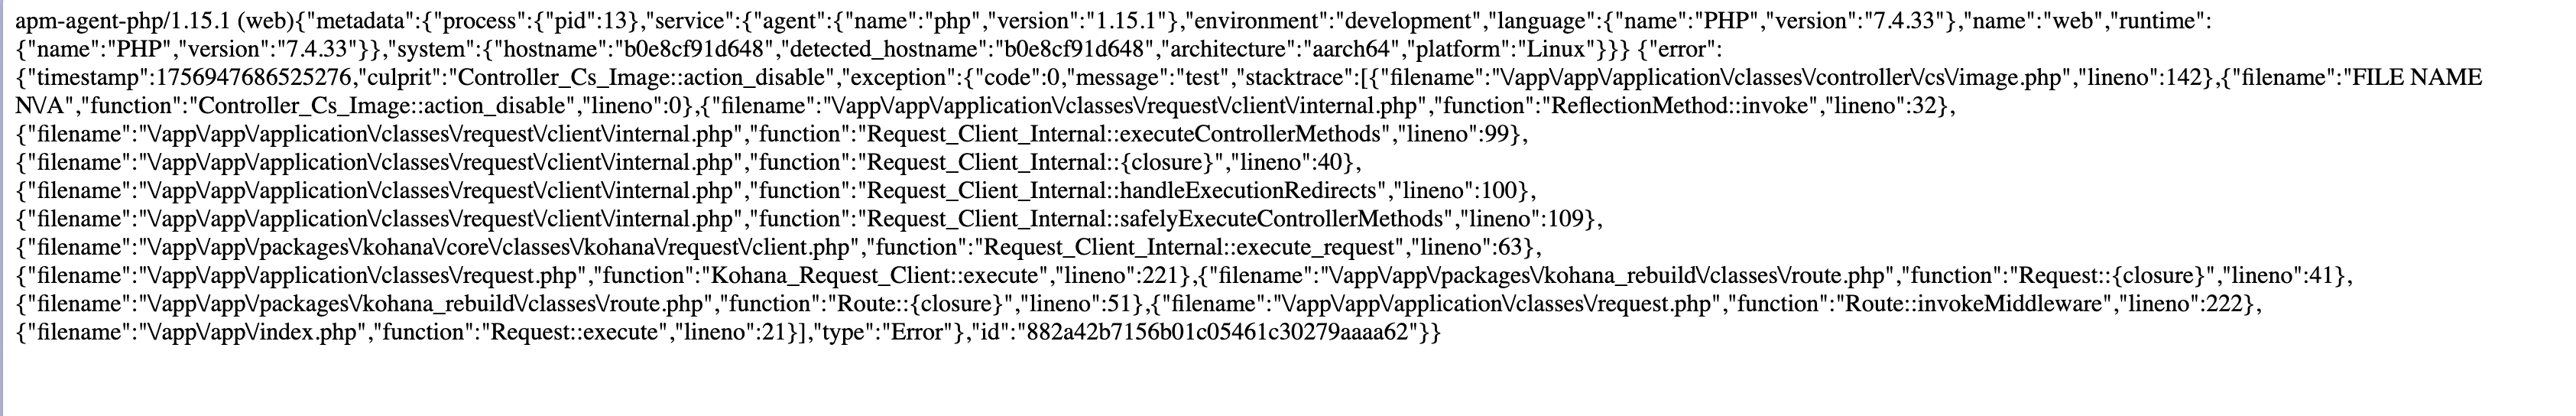
Hi Oliver, thanks for digging deeper and sharing the debug details.
If the stack trace is visible all the way to elastic_apm_send_to_server but disappears in Kibana, that strongly suggests it’s being dropped either by the C extension or on the UI side. Since you’re already on 1.15.0, I’d recommend:
Double-check elastic_apm.stack_trace_limit is not set to 0.
Try upgrading to the latest release (>= 1.15.1) there have been fixes around error payload serialization.
If it still happens, it might be worth opening a GitHub issue with the debug output, as this looks like an agent bug rather than configuration
Have you tried reproducing with a minimal script that just throws an exception and calls createErrorFromThrowable? That could help isolate if it’s something in the integration layer vs. the core agent.
Apache, Apache Lucene, Apache Hadoop, Hadoop, HDFS and the yellow elephant
logo are trademarks of the
Apache Software Foundation
in the United States and/or other countries.