Hi Stephen,
thanks for your reply:
The field in question ist the time-taken field from the Windows IIS Log:
This is the part in the Module Pipeline Defintion:
- script:
    lang: painless
    source: ctx.event.duration = Math.round(ctx.temp.duration * params.scale)
    params:
      scale: 1000000
    if: ctx.temp?.duration != null
This field is usualy milliseconds. I can understand that there are steps taken to harmonize time units . I was just a bit curious why it is scaled by such a big factor.
When we start to write and use our custom filebeat-modules we want to use also ecs format as it seems to be an usefull thing worth taking into consideration. So i want to stay as close to default settings as possible.
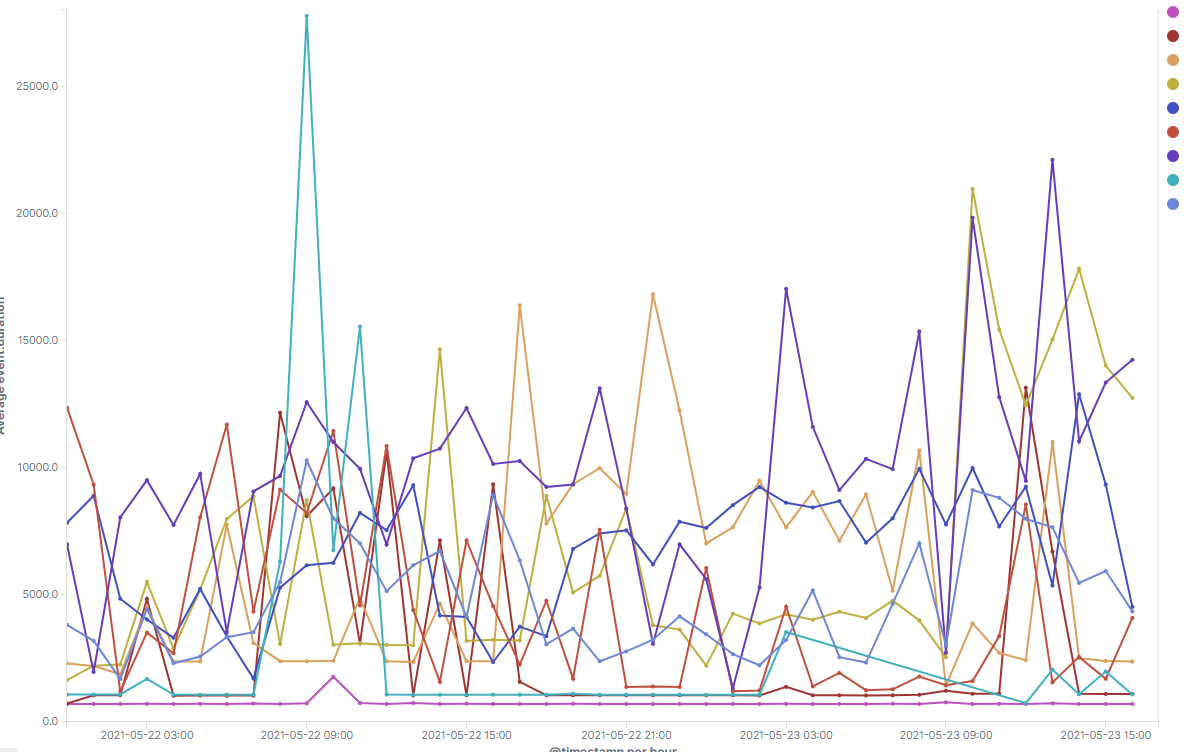
Currently i'm just playing a bit around and tried to do a simple timebased line chart showing iis time taken -> that was the point where i started looking for as the values did seem a bit high for iis response times