I installed winlogbeat and Logstash on my WInodows and I want to send logs to Logstash that will forward the logs to pfSense,I mean using Logstash as an aggregator with the logstash-output-tcp to send events to Syslog. any idea how can I do it ?
Hi @mariya,
How will pfSense accept the data? Through syslog? You'd basically configure logstash to read all the inputs you want and then setup the right outputs. Logstash supports syslog and tcp as outputs so it is probably possible.
Is this configuration correct

It looks reasonable. If you are able to paste the configuration as text that makes it easier for me to work with. Does logstash start up without throwing errors about the configuration file? You can also verify specific files with:
logstash -f <path_config_file> -t
If everything looks good you'll see it say: "Configuration OK".
here is the configuration:
input {
  beats {
    port => 5044
  }
}
filter {
  grok {
   paterns_dir =>["/etc/logstash/patter"]
   match => {"message"=> "%{IPORHOST:clientip} %{NGUSER:ident} %{NGUSER:auth} \[%{HTTPDATE:timestamp}\"%{WORD:verb} %{URIPATHPARAM:request}
   HTTP/%{NUMBER:httpversion}\" %NUMBER:response}"
}
   }
output {
  syslog {
    hosts => "192.168.2.250"
    port => 514
    protocol => "tcp"
  }
}
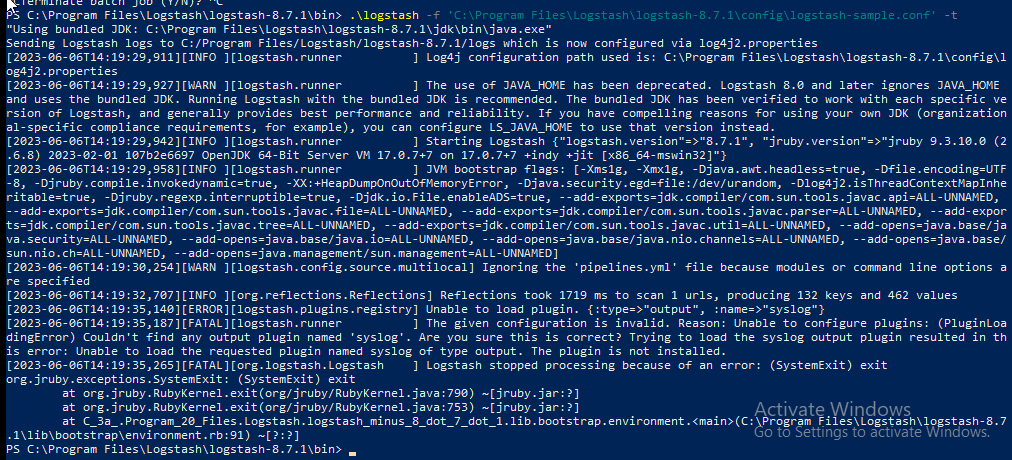
and the output of the command logstash -f <path_config_file> -t
Ok, looks like syslog output plugin isn't installed but can be installed easily as documented here.
No problem, so it actually looks like a different problem that is still causing it to ultimately fail. Can you paste the whole error message as text please. Images are really hard for us to work with.
here is the whole error message:
"Using bundled JDK: c:\Program Files\Logstash\logstash-8.7.1\jdk\bin\java.exe"
Sending Logstash logs to c:/Program Files/Logstash/logstash-8.7.1/logs which is now configured via log4j2.properties
[2023-06-06T15:20:52,345][INFO ][logstash.runner          ] Log4j configuration path used is: c:\Program Files\Logstash\logstash-8.7.1\config\log4j2.properties
[2023-06-06T15:20:52,423][WARN ][logstash.runner          ] The use of JAVA_HOME has been deprecated. Logstash 8.0 and later ignores JAVA_HOME and uses the bundled JDK. Running Logstash with the bundled JDK is recommended. The bundled JDK has been verified to work with each specific version of Logstash, and generally provides best performance and reliability. If you have compelling reasons for using your own JDK (organizational-specific compliance requirements, for example), you can configure LS_JAVA_HOME to use that version instead.
[2023-06-06T15:20:52,423][INFO ][logstash.runner          ] Starting Logstash {"logstash.version"=>"8.7.1", "jruby.version"=>"jruby 9.3.10.0 (2.6.8) 2023-02-01 107b2e6697 OpenJDK 64-Bit Server VM 17.0.7+7 on 17.0.7+7 +indy +jit [x86_64-mswin32]"}
[2023-06-06T15:20:52,444][INFO ][logstash.runner          ] JVM bootstrap flags: [-Xms1g, -Xmx1g, -Djava.awt.headless=true, -Dfile.encoding=UTF-8, -Djruby.compile.invokedynamic=true, -XX:+HeapDumpOnOutOfMemoryError, -Djava.security.egd=file:/dev/urandom, -Dlog4j2.isThreadContextMapInheritable=true, -Djruby.regexp.interruptible=true, -Djdk.io.File.enableADS=true, --add-exports=jdk.compiler/com.sun.tools.javac.api=ALL-UNNAMED, --add-exports=jdk.compiler/com.sun.tools.javac.file=ALL-UNNAMED, --add-exports=jdk.compiler/com.sun.tools.javac.parser=ALL-UNNAMED, --add-exports=jdk.compiler/com.sun.tools.javac.tree=ALL-UNNAMED, --add-exports=jdk.compiler/com.sun.tools.javac.util=ALL-UNNAMED, --add-opens=java.base/java.security=ALL-UNNAMED, --add-opens=java.base/java.io=ALL-UNNAMED, --add-opens=java.base/java.nio.channels=ALL-UNNAMED, --add-opens=java.base/sun.nio.ch=ALL-UNNAMED, --add-opens=java.management/sun.management=ALL-UNNAMED]
[2023-06-06T15:20:52,678][WARN ][logstash.config.source.multilocal] Ignoring the 'pipelines.yml' file because modules or command line options are specified
[2023-06-06T15:20:57,416][ERROR][logstash.agent           ] Failed to execute action {:action=>LogStash::PipelineAction::Create/pipeline_id:main, :exception=>"LogStash::ConfigurationError", :message=>"Expected one of [ \\t\\r\\n], \"#\", \"=>\" at line 17, column 10 (byte 420) after filter {\n  grok {\n   paterns_dir =>[\"/etc/logstash/patter\"]\n   match => {\"message\"=> \"%{IPORHOST:clientip} %{NGUSER:ident} %{NGUSER:auth} \\[%{HTTPDATE:timestamp}\\\"%{WORD:verb} %{URIPATHPARAM:request}\n   HTTP/%{NUMBER:httpversion}\\\" %NUMBER:response}\"\n}\n   }\noutput {\n  syslog ", :backtrace=>["C:/Program Files/Logstash/logstash-8.7.1/logstash-core/lib/logstash/compiler.rb:32:in `compile_imperative'", "org/logstash/execution/AbstractPipelineExt.java:239:in `initialize'", "org/logstash/execution/AbstractPipelineExt.java:173:in `initialize'", "C:/Program Files/Logstash/logstash-8.7.1/logstash-core/lib/logstash/java_pipeline.rb:48:in `initialize'", "org/jruby/RubyClass.java:911:in `new'", "C:/Program Files/Logstash/logstash-8.7.1/logstash-core/lib/logstash/pipeline_action/create.rb:50:in `execute'", "C:/Program Files/Logstash/logstash-8.7.1/logstash-core/lib/logstash/agent.rb:386:in `block in converge_state'"]}
[2023-06-06T15:20:57,996][INFO ][logstash.agent           ] Successfully started Logstash API endpoint {:port=>9600, :ssl_enabled=>false}
[2023-06-06T15:20:58,091][INFO ][logstash.runner          ] Logstash shut down.
[2023-06-06T15:20:58,123][FATAL][org.logstash.Logstash    ] Logstash stopped processing because of an error: (SystemExit) exit
org.jruby.exceptions.SystemExit: (SystemExit) exit
        at org.jruby.RubyKernel.exit(org/jruby/RubyKernel.java:790) ~[jruby.jar:?]
        at org.jruby.RubyKernel.exit(org/jruby/RubyKernel.java:753) ~[jruby.jar:?]
        at c_3a_.Program_20_Files.Logstash.logstash_minus_8_dot_7_dot_1.lib.bootstrap.environment.<main>(c:\Program Files\Logstash\logstash-8.7.1\lib\bootstrap\environment.rb:91) ~[?:?]
For this kind of error you need to check in the system log for any hint why the service cannot start, look in /var/log/messages or /var/log/syslog.
I think you need to move the quote to the other side of the bracket on "match" line:
match => {"message"=> "%{IPORHOST:clientip} %{NGUSER:ident} %{NGUSER:auth} \[%{HTTPDATE:timestamp}\"%{WORD:verb} %{URIPATHPARAM:request} HTTP/%{NUMBER:httpversion}\" %NUMBER:response"}
Same error I tried to change all the filter:
filter {
    grok {
        match => { "message" => "%{COMBINEDAPACHELOG}" }
    }

    date {
        match => [ "timestamp" , "dd/MMM/yyyy:HH:mm:ss Z" ]
    }

    mutate {
        convert => {
            "response" => "integer"
            "bytes" => "integer"
        }
    }
}
I think the problem is not in the syntax
I'm using Windows I think /var/log/messages and /var/log/syslog work on Unix so I found that the equivalent of them is Event Viewer:
It might not be a syntax error, but the error quoted above is what led me to believe there was something off. If it is logging to the event viewer can you provide the relevant logstash logs? There isn't much we can do with a screenshot of event viewer.
I wanted to inform you that despite my exhaustive efforts, none of the attempted solutions resolved the issues I was facing. As a result, I was compelled to make significant changes to my topology and configuration. I appreciate your valuable time and support throughout this process. Thank you so much.
Ok, sorry to hear that, and that we weren't able to get this figured out.
This topic was automatically closed 28 days after the last reply. New replies are no longer allowed.


