Setting Up Logstash In Docker-Compose For Bulk Ingest Of CSV Files In Local Machine

Got the fix
image
In accordance with

Error is still

2023-11-16 01:55:37 [2023-11-15T17:55:37,873][INFO ][logstash.agent           ] Successfully started Logstash API endpoint {:port=>9600, :ssl_enabled=>false}
2023-11-16 01:55:38 [2023-11-15T17:55:38,874][ERROR][logstash.agent           ] Failed to execute action {:action=>LogStash::PipelineAction::Create/pipeline_id:main, :exception=>"LogStash::ConfigurationError", :message=>"Expected one of [^\\r\\n], \"\\r\", \"\\n\" at line 46, column 4 (byte 1126) after # }", :backtrace=>["/usr/share/logstash/logstash-core/lib/logstash/compiler.rb:32:in `compile_imperative'", "org/logstash/execution/AbstractPipelineExt.java:239:in `initialize'", "org/logstash/execution/AbstractPipelineExt.java:173:in `initialize'", "/usr/share/logstash/logstash-core/lib/logstash/java_pipeline.rb:48:in `initialize'", "org/jruby/RubyClass.java:931:in `new'", "/usr/share/logstash/logstash-core/lib/logstash/pipeline_action/create.rb:49:in `execute'", "/usr/share/logstash/logstash-core/lib/logstash/agent.rb:386:in `block in converge_state'"]}
1 Like

Error is still

2023-11-16 01:55:37 [2023-11-15T17:55:37,873][INFO ][logstash.agent           ] Successfully started Logstash API endpoint {:port=>9600, :ssl_enabled=>false}
2023-11-16 01:55:38 [2023-11-15T17:55:38,874][ERROR][logstash.agent           ] Failed to execute action {:action=>LogStash::PipelineAction::Create/pipeline_id:main, :exception=>"LogStash::ConfigurationError", :message=>"Expected one of [^\\r\\n], \"\\r\", \"\\n\" at line 46, column 4 (byte 1126) after # }", :backtrace=>["/usr/share/logstash/logstash-core/lib/logstash/compiler.rb:32:in `compile_imperative'", "org/logstash/execution/AbstractPipelineExt.java:239:in `initialize'", "org/logstash/execution/AbstractPipelineExt.java:173:in `initialize'", "/usr/share/logstash/logstash-core/lib/logstash/java_pipeline.rb:48:in `initialize'", "org/jruby/RubyClass.java:931:in `new'", "/usr/share/logstash/logstash-core/lib/logstash/pipeline_action/create.rb:49:in `execute'", "/usr/share/logstash/logstash-core/lib/logstash/agent.rb:386:in `block in converge_state'"]}

First screen shots are not good please try to paste the actual text

    volumes:
      - ./:/usr/share/logstash/pipeline/
      - "D:\ATS_Event_Logs\Logstash:/logs/csv_files"

This was just an example you need to put your real path in.

Do you actually have files at "D:\ATS_Event_Logs\Logstash" that is where your csv file are... in real life, in real path, on the "host" not docker.

You are going to need to figure it out... also you need to show me the config and the error everytime otherwise I am just guessing!

so you could try that big long mount path... (oh wait I can not cut and paste it because it is an image)

Again I would try everything on a local drive first... then try all your other stuff...

Perhaps you need to read about mounting volumes in docker

The format is:

- "/host/path/to/data:/docker/path/to/data"

in your case the host is probably that giangatic path... whether that will work I have no clue... /c/mnt/Users/...... I would quote it but I have not clue whether that would work.

Again I would suggest to use local drives ...

This was just an example you need to put your real path in.

Yes. This is a real path. And everything has to be / and not the fwd-slash ""

Do you actually have files at "D:\ATS_Event_Logs\Logstash" that is where your csv file are... in real life, in real path, on the "host" not docker.

Yes (537 csv files)
image

Config

input { 
    file { 
        path => "/logs/csv_files/*.csv"
        start_position => "beginning" 
        sincedb_path => "NULL"
    } 
}
filter { 
    csv { 
        separator => ","
        columns => [ "id","uniqueid","alarm","eventtype","system","subsystem","sourcetime","operator","alarmvalue","value","equipment","location","severity","description","state","mmsstate","zone","graphicelement"] 
    } 
}

output { 
    elasticsearch { 
        index => "ats-logs" 
        hosts => ["https://es01:9200"]
        manage_template => false
        user => "elastic"
        password => "elastic123"
        ssl_verification_mode=> "none" #comment away
        # ssl_enabled => true
        # cacert => "/usr/share/logstash/certs/ca/ca.crt"
    }
    stdout{} 
}

error

2023-11-16 02:05:08 [2023-11-15T18:05:08,918][ERROR][logstash.agent           ] Failed to execute action {:action=>LogStash::PipelineAction::Create/pipeline_id:main, :exception=>"LogStash::ConfigurationError", :message=>"Expected one of [^\\r\\n], \"\\r\", \"\\n\" at line 46, column 4 (byte 1126) after # }", :backtrace=>["/usr/share/logstash/logstash-core/lib/logstash/compiler.rb:32:in `compile_imperative'", "org/logstash/execution/AbstractPipelineExt.java:239:in `initialize'", "org/logstash/execution/AbstractPipelineExt.java:173:in `initialize'", "/usr/share/logstash/logstash-core/lib/logstash/java_pipeline.rb:48:in `initialize'", "/usr/share/logstash/logstash-core/lib/logstash/pipeline_action/create.rb:49:in `execute'", "/usr/share/logstash/logstash-core/lib/logstash/agent.rb:386:in `block in converge_state'"]}

I have changed my file space to be local as per

Pls disregard the "OneDrive" ref inside my path. Its basically Windows 11's Documents folder I'm running my docker-env now.

Hope this solves and we can continue troublshooting.

That is a syntax error in the conf file... not sure what at first glance take out that comment after...

ssl_verification_mode=> "none"

Also Pro Tip I would not start with

path => "/logs/csv_files/*.csv"

I would start with one file first example

path => "/logs/csv_files/events2022-01-01.csv"

I think I have improvement. The pipeline appears setup but I dont see the json objects showing up (ie parsing of each csv row into the pipeline).

logstash.conf

input { 
    file { 
        path => "/logs/csv_files/*.csv"
        start_position => "beginning" 
        sincedb_path => "NULL"
    } 
}
filter { 
    csv { 
        separator => ","
        columns => [ "id","uniqueid","alarm","eventtype","system","subsystem","sourcetime","operator","alarmvalue","value","equipment","location","severity","description","state","mmsstate","zone","graphicelement"] 
    } 
}

output { 
    elasticsearch { 
        index => "ats-logs" 
        hosts => ["https://es01:9200"]
        manage_template => false
        user => "elastic"
        password => "elastic123"
        ssl_verification_mode=> "none"
    }
    stdout{} 
}

docker-compose.yml

version: "3.8"

volumes:
  logstashdata01:
    driver: local

networks:
  default:
    name: elastic
    external: true
    
services:
  logstash:
    image: docker.elastic.co/logstash/logstash:${STACK_VERSION}
    labels:
      co.elastic.logs/module: logstash
    user: root
    environment:
      - xpack.monitoring.enabled=false
    volumes:
      - ./:/usr/share/logstash/pipeline/
      - /d/ATS_Event_Logs/Logstash:/logs/csv_files"
    command: logstash -r -f /usr/share/logstash/pipeline/logstash.conf
    ports:
      - "5044:5044"
    mem_limit: ${LS_MEM_LIMIT}


# version: "3.8"

# volumes:
#   logstashdata01:
#     driver: local

# networks:
#   default:
#     name: elastic
#     external: true
    
# services:
#   setup:
#   logstash:
#     image: docker.elastic.co/logstash/logstash:${STACK_VERSION}
#     labels:
#       co.elastic.logs/module: logstash
#     user: root
#     volumes:
#       - logstashdata01:/usr/share/logstash/data
#       - certs:/usr/share/logstash/certs
#       - ./logstash.conf:/usr/share/logstash/pipeline/logstash.conf:ro
#     environment:
#       - NODE_NAME="logstash"
#       - xpack.monitoring.enabled=false
#       - ELASTIC_USER=elastic
#       - ELASTIC_PASSWORD={ELASTIC_PASSWORD}
#       - ELASTIC_HOSTS=https://es01:9200
#     command: logstash -f /usr/share/logstash/pipeline/logstash.conf
#     ports:
#       - "5044:5044"
#     mem_limit: ${LS_MEM_LIMIT}

Logs

2023-11-16 10:34:25 Using bundled JDK: /usr/share/logstash/jdk
2023-11-16 10:34:54 Sending Logstash logs to /usr/share/logstash/logs which is now configured via log4j2.properties
2023-11-16 10:34:54 [2023-11-16T02:34:54,588][WARN ][deprecation.logstash.runner] NOTICE: Running Logstash as superuser is not recommended and won't be allowed in the future. Set 'allow_superuser' to 'false' to avoid startup errors in future releases.
2023-11-16 10:34:54 [2023-11-16T02:34:54,607][INFO ][logstash.runner          ] Log4j configuration path used is: /usr/share/logstash/config/log4j2.properties
2023-11-16 10:34:54 [2023-11-16T02:34:54,611][INFO ][logstash.runner          ] Starting Logstash {"logstash.version"=>"8.11.0", "jruby.version"=>"jruby 9.4.2.0 (3.1.0) 2023-03-08 90d2913fda OpenJDK 64-Bit Server VM 17.0.9+9 on 17.0.9+9 +indy +jit [x86_64-linux]"}
2023-11-16 10:34:54 [2023-11-16T02:34:54,616][INFO ][logstash.runner          ] JVM bootstrap flags: [-Xms1g, -Xmx1g, -Djava.awt.headless=true, -Dfile.encoding=UTF-8, -Djruby.compile.invokedynamic=true, -XX:+HeapDumpOnOutOfMemoryError, -Djava.security.egd=file:/dev/urandom, -Dlog4j2.isThreadContextMapInheritable=true, -Dls.cgroup.cpuacct.path.override=/, -Dls.cgroup.cpu.path.override=/, -Djruby.regexp.interruptible=true, -Djdk.io.File.enableADS=true, --add-exports=jdk.compiler/com.sun.tools.javac.api=ALL-UNNAMED, --add-exports=jdk.compiler/com.sun.tools.javac.file=ALL-UNNAMED, --add-exports=jdk.compiler/com.sun.tools.javac.parser=ALL-UNNAMED, --add-exports=jdk.compiler/com.sun.tools.javac.tree=ALL-UNNAMED, --add-exports=jdk.compiler/com.sun.tools.javac.util=ALL-UNNAMED, --add-opens=java.base/java.security=ALL-UNNAMED, --add-opens=java.base/java.io=ALL-UNNAMED, --add-opens=java.base/java.nio.channels=ALL-UNNAMED, --add-opens=java.base/sun.nio.ch=ALL-UNNAMED, --add-opens=java.management/sun.management=ALL-UNNAMED]
2023-11-16 10:34:54 [2023-11-16T02:34:54,638][INFO ][logstash.settings        ] Creating directory {:setting=>"path.queue", :path=>"/usr/share/logstash/data/queue"}
2023-11-16 10:34:54 [2023-11-16T02:34:54,641][INFO ][logstash.settings        ] Creating directory {:setting=>"path.dead_letter_queue", :path=>"/usr/share/logstash/data/dead_letter_queue"}
2023-11-16 10:34:55 [2023-11-16T02:34:55,002][WARN ][logstash.config.source.multilocal] Ignoring the 'pipelines.yml' file because modules or command line options are specified
2023-11-16 10:34:55 [2023-11-16T02:34:55,026][INFO ][logstash.agent           ] No persistent UUID file found. Generating new UUID {:uuid=>"3d0ac5c3-1817-445c-a396-17ed7034d597", :path=>"/usr/share/logstash/data/uuid"}
2023-11-16 10:34:56 [2023-11-16T02:34:56,263][INFO ][logstash.agent           ] Successfully started Logstash API endpoint {:port=>9600, :ssl_enabled=>false}
2023-11-16 10:34:57 [2023-11-16T02:34:57,531][INFO ][org.reflections.Reflections] Reflections took 258 ms to scan 1 urls, producing 132 keys and 464 values
2023-11-16 10:34:59 [2023-11-16T02:34:59,026][INFO ][logstash.javapipeline    ] Pipeline `main` is configured with `pipeline.ecs_compatibility: v8` setting. All plugins in this pipeline will default to `ecs_compatibility => v8` unless explicitly configured otherwise.
2023-11-16 10:34:59 [2023-11-16T02:34:59,055][INFO ][logstash.outputs.elasticsearch][main] New Elasticsearch output {:class=>"LogStash::Outputs::ElasticSearch", :hosts=>["https://es01:9200"]}
2023-11-16 10:34:59 [2023-11-16T02:34:59,063][WARN ][logstash.outputs.elasticsearch][main] You have enabled encryption but DISABLED certificate verification, to make sure your data is secure set `ssl_verification_mode => full`
2023-11-16 10:34:59 [2023-11-16T02:34:59,346][INFO ][logstash.outputs.elasticsearch][main] Elasticsearch pool URLs updated {:changes=>{:removed=>[], :added=>[https://elastic:xxxxxx@es01:9200/]}}
2023-11-16 10:34:59 [2023-11-16T02:34:59,789][WARN ][logstash.outputs.elasticsearch][main] Restored connection to ES instance {:url=>"https://elastic:xxxxxx@es01:9200/"}
2023-11-16 10:34:59 [2023-11-16T02:34:59,791][INFO ][logstash.outputs.elasticsearch][main] Elasticsearch version determined (8.11.0) {:es_version=>8}
2023-11-16 10:34:59 [2023-11-16T02:34:59,792][WARN ][logstash.outputs.elasticsearch][main] Detected a 6.x and above cluster: the `type` event field won't be used to determine the document _type {:es_version=>8}
2023-11-16 10:34:59 [2023-11-16T02:34:59,822][INFO ][logstash.outputs.elasticsearch][main] Not eligible for data streams because config contains one or more settings that are not compatible with data streams: {"index"=>"ats-logs"}
2023-11-16 10:34:59 [2023-11-16T02:34:59,823][INFO ][logstash.outputs.elasticsearch][main] Data streams auto configuration (`data_stream => auto` or unset) resolved to `false`
2023-11-16 10:34:59 [2023-11-16T02:34:59,832][INFO ][logstash.filters.csv     ][main] ECS compatibility is enabled but `target` option was not specified. This may cause fields to be set at the top-level of the event where they are likely to clash with the Elastic Common Schema. It is recommended to set the `target` option to avoid potential schema conflicts (if your data is ECS compliant or non-conflicting, feel free to ignore this message)
2023-11-16 10:34:59 [2023-11-16T02:34:59,866][INFO ][logstash.javapipeline    ][main] Starting pipeline {:pipeline_id=>"main", "pipeline.workers"=>8, "pipeline.batch.size"=>125, "pipeline.batch.delay"=>50, "pipeline.max_inflight"=>1000, "pipeline.sources"=>["/usr/share/logstash/pipeline/logstash.conf"], :thread=>"#<Thread:0x57985312 /usr/share/logstash/logstash-core/lib/logstash/java_pipeline.rb:134 run>"}
2023-11-16 10:35:01 [2023-11-16T02:35:01,685][INFO ][logstash.javapipeline    ][main] Pipeline Java execution initialization time {"seconds"=>1.82}
2023-11-16 10:35:01 [2023-11-16T02:35:01,704][INFO ][logstash.javapipeline    ][main] Pipeline started {"pipeline.id"=>"main"}
2023-11-16 10:35:01 [2023-11-16T02:35:01,724][INFO ][filewatch.observingtail  ][main][e02c9724c891efb1566ae46168785e2fbdf858e6919ac37455d441ec44a7d909] START, creating Discoverer, Watch with file and sincedb collections
2023-11-16 10:35:01 [2023-11-16T02:35:01,737][INFO ][logstash.agent           ] Pipelines running {:count=>1, :running_pipelines=>[:main], :non_running_pipelines=>[]}
2023-11-16 10:34:25 2023/11/16 02:34:25 Setting 'xpack.monitoring.enabled' from environment.

Tricky.... Since docker is unix...

Try this

sincedb_path => "/dev/null"

1 Like

Just restarted with your changes

2023-11-16 12:13:43 [2023-11-16T04:13:43,147][INFO ][logstash.javapipeline    ][main] Pipeline Java execution initialization time {"seconds"=>1.54}
2023-11-16 12:13:43 [2023-11-16T04:13:43,184][INFO ][logstash.javapipeline    ][main] Pipeline started {"pipeline.id"=>"main"}
2023-11-16 12:13:43 [2023-11-16T04:13:43,195][INFO ][filewatch.observingtail  ][main][3726e1afd48fdf13f53f0e299cae61dd5db4312044d48158ddb6d7744354ce81] START, creating Discoverer, Watch with file and sincedb collections
2023-11-16 12:13:43 [2023-11-16T04:13:43,214][INFO ][logstash.agent           ] Pipelines running {:count=>1, :running_pipelines=>[:main], :non_running_pipelines=>[]}

Now from what I observe, the logs get stuck here. It will tell me Pipeline is running but nothing happens after that.

No error but yet no ingestion.

logstash.conf

input { 
    file { 
        path => "/logs/csv_files/*.csv"
        start_position => "beginning" 
        sincedb_path => "/dev/null"
    } 
}

# input {
#   beats {
#     port => 5044
#   }
# }

filter { 
    csv { 
        separator => ","
        columns => [ "id","uniqueid","alarm","eventtype","system","subsystem","sourcetime","operator","alarmvalue","value","equipment","location","severity","description","state","mmsstate","zone","graphicelement"] 
    } 
}

output { 
    elasticsearch { 
        index => "ats-logs" 
        hosts => ["https://es01:9200"]
        manage_template => false
        user => "elastic"
        password => "elastic123"
        ssl_verification_mode=> "none"
    }
    stdout{} 
}

docker-compose.yml

version: "3.8"

volumes:
  logstashdata01:
    driver: local

networks:
  default:
    name: elastic
    external: true
    
services:
  logstash:
    image: docker.elastic.co/logstash/logstash:${STACK_VERSION}
    labels:
      co.elastic.logs/module: logstash
    user: root
    environment:
      - xpack.monitoring.enabled=false
    volumes:
      - ./:/usr/share/logstash/pipeline/
      - /d/ATS_Event_Logs/For-Logstash_(ML)/Logstash:/logs/csv_files"
    command: logstash -r -f /usr/share/logstash/pipeline/logstash.conf
    ports:
      - "5044:5044"
    mem_limit: ${LS_MEM_LIMIT}

Do
docker-compose down
Then
docker-compose up
And show all the logs...

And AGAIN 1 file only not *.csv

@Ethan777100 I am making these suggestions for a reason... It would help if you followed.

here.

btw i saw this inside the logs: -XX:+HeapDumpOnOutOfMemoryError,

2023-11-16 14:19:20 2023/11/16 06:19:20 Setting 'xpack.monitoring.enabled' from environment.
2023-11-16 14:19:20 Using bundled JDK: /usr/share/logstash/jdk
2023-11-16 14:19:40 Sending Logstash logs to /usr/share/logstash/logs which is now configured via log4j2.properties
2023-11-16 14:19:41 [2023-11-16T06:19:41,009][WARN ][deprecation.logstash.runner] NOTICE: Running Logstash as superuser is not recommended and won't be allowed in the future. Set 'allow_superuser' to 'false' to avoid startup errors in future releases.
2023-11-16 14:19:41 [2023-11-16T06:19:41,030][INFO ][logstash.runner          ] Log4j configuration path used is: /usr/share/logstash/config/log4j2.properties
2023-11-16 14:19:41 [2023-11-16T06:19:41,033][INFO ][logstash.runner          ] Starting Logstash {"logstash.version"=>"8.11.0", "jruby.version"=>"jruby 9.4.2.0 (3.1.0) 2023-03-08 90d2913fda OpenJDK 64-Bit Server VM 17.0.9+9 on 17.0.9+9 +indy +jit [x86_64-linux]"}
2023-11-16 14:19:41 [2023-11-16T06:19:41,037][INFO ][logstash.runner          ] JVM bootstrap flags: [-Xms1g, -Xmx1g, -Djava.awt.headless=true, -Dfile.encoding=UTF-8, -Djruby.compile.invokedynamic=true, -XX:+HeapDumpOnOutOfMemoryError, -Djava.security.egd=file:/dev/urandom, -Dlog4j2.isThreadContextMapInheritable=true, -Dls.cgroup.cpuacct.path.override=/, -Dls.cgroup.cpu.path.override=/, -Djruby.regexp.interruptible=true, -Djdk.io.File.enableADS=true, --add-exports=jdk.compiler/com.sun.tools.javac.api=ALL-UNNAMED, --add-exports=jdk.compiler/com.sun.tools.javac.file=ALL-UNNAMED, --add-exports=jdk.compiler/com.sun.tools.javac.parser=ALL-UNNAMED, --add-exports=jdk.compiler/com.sun.tools.javac.tree=ALL-UNNAMED, --add-exports=jdk.compiler/com.sun.tools.javac.util=ALL-UNNAMED, --add-opens=java.base/java.security=ALL-UNNAMED, --add-opens=java.base/java.io=ALL-UNNAMED, --add-opens=java.base/java.nio.channels=ALL-UNNAMED, --add-opens=java.base/sun.nio.ch=ALL-UNNAMED, --add-opens=java.management/sun.management=ALL-UNNAMED]
2023-11-16 14:19:41 [2023-11-16T06:19:41,057][INFO ][logstash.settings        ] Creating directory {:setting=>"path.queue", :path=>"/usr/share/logstash/data/queue"}
2023-11-16 14:19:41 [2023-11-16T06:19:41,062][INFO ][logstash.settings        ] Creating directory {:setting=>"path.dead_letter_queue", :path=>"/usr/share/logstash/data/dead_letter_queue"}
2023-11-16 14:19:41 [2023-11-16T06:19:41,308][WARN ][logstash.config.source.multilocal] Ignoring the 'pipelines.yml' file because modules or command line options are specified
2023-11-16 14:19:41 [2023-11-16T06:19:41,321][INFO ][logstash.agent           ] No persistent UUID file found. Generating new UUID {:uuid=>"d344b318-4a2c-4158-8a89-48dc2550f33e", :path=>"/usr/share/logstash/data/uuid"}
2023-11-16 14:19:42 [2023-11-16T06:19:42,153][INFO ][logstash.agent           ] Successfully started Logstash API endpoint {:port=>9600, :ssl_enabled=>false}
2023-11-16 14:19:42 [2023-11-16T06:19:42,755][INFO ][org.reflections.Reflections] Reflections took 131 ms to scan 1 urls, producing 132 keys and 464 values
2023-11-16 14:19:43 [2023-11-16T06:19:43,293][INFO ][logstash.javapipeline    ] Pipeline `main` is configured with `pipeline.ecs_compatibility: v8` setting. All plugins in this pipeline will default to `ecs_compatibility => v8` unless explicitly configured otherwise.
2023-11-16 14:19:43 [2023-11-16T06:19:43,315][INFO ][logstash.outputs.elasticsearch][main] New Elasticsearch output {:class=>"LogStash::Outputs::ElasticSearch", :hosts=>["https://es01:9200"]}
2023-11-16 14:19:43 [2023-11-16T06:19:43,322][WARN ][logstash.outputs.elasticsearch][main] You have enabled encryption but DISABLED certificate verification, to make sure your data is secure set `ssl_verification_mode => full`
2023-11-16 14:19:43 [2023-11-16T06:19:43,513][INFO ][logstash.outputs.elasticsearch][main] Elasticsearch pool URLs updated {:changes=>{:removed=>[], :added=>[https://elastic:xxxxxx@es01:9200/]}}
2023-11-16 14:19:43 [2023-11-16T06:19:43,781][WARN ][logstash.outputs.elasticsearch][main] Restored connection to ES instance {:url=>"https://elastic:xxxxxx@es01:9200/"}
2023-11-16 14:19:43 [2023-11-16T06:19:43,782][INFO ][logstash.outputs.elasticsearch][main] Elasticsearch version determined (8.11.0) {:es_version=>8}
2023-11-16 14:19:43 [2023-11-16T06:19:43,782][WARN ][logstash.outputs.elasticsearch][main] Detected a 6.x and above cluster: the `type` event field won't be used to determine the document _type {:es_version=>8}
2023-11-16 14:19:43 [2023-11-16T06:19:43,798][INFO ][logstash.outputs.elasticsearch][main] Not eligible for data streams because config contains one or more settings that are not compatible with data streams: {"index"=>"ats-logs"}
2023-11-16 14:19:43 [2023-11-16T06:19:43,798][INFO ][logstash.outputs.elasticsearch][main] Data streams auto configuration (`data_stream => auto` or unset) resolved to `false`
2023-11-16 14:19:43 [2023-11-16T06:19:43,802][INFO ][logstash.filters.csv     ][main] ECS compatibility is enabled but `target` option was not specified. This may cause fields to be set at the top-level of the event where they are likely to clash with the Elastic Common Schema. It is recommended to set the `target` option to avoid potential schema conflicts (if your data is ECS compliant or non-conflicting, feel free to ignore this message)
2023-11-16 14:19:43 [2023-11-16T06:19:43,823][INFO ][logstash.javapipeline    ][main] Starting pipeline {:pipeline_id=>"main", "pipeline.workers"=>8, "pipeline.batch.size"=>125, "pipeline.batch.delay"=>50, "pipeline.max_inflight"=>1000, "pipeline.sources"=>["/usr/share/logstash/pipeline/logstash.conf"], :thread=>"#<Thread:0x23510226 /usr/share/logstash/logstash-core/lib/logstash/java_pipeline.rb:134 run>"}
2023-11-16 14:19:44 [2023-11-16T06:19:44,791][INFO ][logstash.javapipeline    ][main] Pipeline Java execution initialization time {"seconds"=>0.97}
2023-11-16 14:19:44 [2023-11-16T06:19:44,808][INFO ][logstash.javapipeline    ][main] Pipeline started {"pipeline.id"=>"main"}
2023-11-16 14:19:44 [2023-11-16T06:19:44,815][INFO ][filewatch.observingtail  ][main][3726e1afd48fdf13f53f0e299cae61dd5db4312044d48158ddb6d7744354ce81] START, creating Discoverer, Watch with file and sincedb collections
2023-11-16 14:19:44 [2023-11-16T06:19:44,828][INFO ][logstash.agent           ] Pipelines running {:count=>1, :running_pipelines=>[:main], :non_running_pipelines=>[]}

Where?
Ohh that is just startup flags...
Should not be a problem...

Make a copy of one of the CSV files and specifically name it in the logstash conf file

Also exec into the logstash container and make sure you can see / the CSV files... Everything pretty much looks good so something simple now like logstash does not see the files

Late here... Check tomorrow

1 Like

Also exec into the logstash container and make sure you can see / the CSV files...

Will be a stupid question - but what do I type inside to do this?

Meanwhile

logstash.conf

input { 
    file { 
        path => "/logs/csv_files/events2022-01-01.csv"
        start_position => "beginning" 
        sincedb_path => "/dev/null"
    } 
}

# input {
#   beats {
#     port => 5044
#   }
# }

filter { 
    csv { 
        separator => ","
        columns => [ "id","uniqueid","alarm","eventtype","system","subsystem","sourcetime","operator","alarmvalue","value","equipment","location","severity","description","state","mmsstate","zone","graphicelement"] 
    } 
}

output { 
    elasticsearch { 
        index => "ats-logs" 
        hosts => ["https://es01:9200"]
        manage_template => false
        user => "elastic"
        password => "elastic123"
        ssl_verification_mode=> "none"
    }
    stdout{} 
}

logs

2023-11-16 14:31:18 Using bundled JDK: /usr/share/logstash/jdk
2023-11-16 14:31:37 Sending Logstash logs to /usr/share/logstash/logs which is now configured via log4j2.properties
2023-11-16 14:31:18 2023/11/16 06:31:18 Setting 'xpack.monitoring.enabled' from environment.
2023-11-16 14:31:37 [2023-11-16T06:31:37,598][WARN ][deprecation.logstash.runner] NOTICE: Running Logstash as superuser is not recommended and won't be allowed in the future. Set 'allow_superuser' to 'false' to avoid startup errors in future releases.
2023-11-16 14:31:37 [2023-11-16T06:31:37,616][INFO ][logstash.runner          ] Log4j configuration path used is: /usr/share/logstash/config/log4j2.properties
2023-11-16 14:31:37 [2023-11-16T06:31:37,619][INFO ][logstash.runner          ] Starting Logstash {"logstash.version"=>"8.11.0", "jruby.version"=>"jruby 9.4.2.0 (3.1.0) 2023-03-08 90d2913fda OpenJDK 64-Bit Server VM 17.0.9+9 on 17.0.9+9 +indy +jit [x86_64-linux]"}
2023-11-16 14:31:37 [2023-11-16T06:31:37,624][INFO ][logstash.runner          ] JVM bootstrap flags: [-Xms1g, -Xmx1g, -Djava.awt.headless=true, -Dfile.encoding=UTF-8, -Djruby.compile.invokedynamic=true, -XX:+HeapDumpOnOutOfMemoryError, -Djava.security.egd=file:/dev/urandom, -Dlog4j2.isThreadContextMapInheritable=true, -Dls.cgroup.cpuacct.path.override=/, -Dls.cgroup.cpu.path.override=/, -Djruby.regexp.interruptible=true, -Djdk.io.File.enableADS=true, --add-exports=jdk.compiler/com.sun.tools.javac.api=ALL-UNNAMED, --add-exports=jdk.compiler/com.sun.tools.javac.file=ALL-UNNAMED, --add-exports=jdk.compiler/com.sun.tools.javac.parser=ALL-UNNAMED, --add-exports=jdk.compiler/com.sun.tools.javac.tree=ALL-UNNAMED, --add-exports=jdk.compiler/com.sun.tools.javac.util=ALL-UNNAMED, --add-opens=java.base/java.security=ALL-UNNAMED, --add-opens=java.base/java.io=ALL-UNNAMED, --add-opens=java.base/java.nio.channels=ALL-UNNAMED, --add-opens=java.base/sun.nio.ch=ALL-UNNAMED, --add-opens=java.management/sun.management=ALL-UNNAMED]
2023-11-16 14:31:37 [2023-11-16T06:31:37,641][INFO ][logstash.settings        ] Creating directory {:setting=>"path.queue", :path=>"/usr/share/logstash/data/queue"}
2023-11-16 14:31:37 [2023-11-16T06:31:37,645][INFO ][logstash.settings        ] Creating directory {:setting=>"path.dead_letter_queue", :path=>"/usr/share/logstash/data/dead_letter_queue"}
2023-11-16 14:31:37 [2023-11-16T06:31:37,894][WARN ][logstash.config.source.multilocal] Ignoring the 'pipelines.yml' file because modules or command line options are specified
2023-11-16 14:31:37 [2023-11-16T06:31:37,909][INFO ][logstash.agent           ] No persistent UUID file found. Generating new UUID {:uuid=>"79f64286-185f-4ad6-89ee-6f0d1ba7bf3c", :path=>"/usr/share/logstash/data/uuid"}
2023-11-16 14:31:38 [2023-11-16T06:31:38,776][INFO ][logstash.agent           ] Successfully started Logstash API endpoint {:port=>9600, :ssl_enabled=>false}
2023-11-16 14:31:39 [2023-11-16T06:31:39,423][INFO ][org.reflections.Reflections] Reflections took 143 ms to scan 1 urls, producing 132 keys and 464 values
2023-11-16 14:31:40 [2023-11-16T06:31:40,040][INFO ][logstash.javapipeline    ] Pipeline `main` is configured with `pipeline.ecs_compatibility: v8` setting. All plugins in this pipeline will default to `ecs_compatibility => v8` unless explicitly configured otherwise.
2023-11-16 14:31:40 [2023-11-16T06:31:40,065][INFO ][logstash.outputs.elasticsearch][main] New Elasticsearch output {:class=>"LogStash::Outputs::ElasticSearch", :hosts=>["https://es01:9200"]}
2023-11-16 14:31:40 [2023-11-16T06:31:40,071][WARN ][logstash.outputs.elasticsearch][main] You have enabled encryption but DISABLED certificate verification, to make sure your data is secure set `ssl_verification_mode => full`
2023-11-16 14:31:40 [2023-11-16T06:31:40,314][INFO ][logstash.outputs.elasticsearch][main] Elasticsearch pool URLs updated {:changes=>{:removed=>[], :added=>[https://elastic:xxxxxx@es01:9200/]}}
2023-11-16 14:31:40 [2023-11-16T06:31:40,650][WARN ][logstash.outputs.elasticsearch][main] Restored connection to ES instance {:url=>"https://elastic:xxxxxx@es01:9200/"}
2023-11-16 14:31:40 [2023-11-16T06:31:40,652][INFO ][logstash.outputs.elasticsearch][main] Elasticsearch version determined (8.11.0) {:es_version=>8}
2023-11-16 14:31:40 [2023-11-16T06:31:40,653][WARN ][logstash.outputs.elasticsearch][main] Detected a 6.x and above cluster: the `type` event field won't be used to determine the document _type {:es_version=>8}
2023-11-16 14:31:40 [2023-11-16T06:31:40,671][INFO ][logstash.outputs.elasticsearch][main] Not eligible for data streams because config contains one or more settings that are not compatible with data streams: {"index"=>"ats-logs"}
2023-11-16 14:31:40 [2023-11-16T06:31:40,673][INFO ][logstash.outputs.elasticsearch][main] Data streams auto configuration (`data_stream => auto` or unset) resolved to `false`
2023-11-16 14:31:40 [2023-11-16T06:31:40,678][INFO ][logstash.filters.csv     ][main] ECS compatibility is enabled but `target` option was not specified. This may cause fields to be set at the top-level of the event where they are likely to clash with the Elastic Common Schema. It is recommended to set the `target` option to avoid potential schema conflicts (if your data is ECS compliant or non-conflicting, feel free to ignore this message)
2023-11-16 14:31:40 [2023-11-16T06:31:40,704][INFO ][logstash.javapipeline    ][main] Starting pipeline {:pipeline_id=>"main", "pipeline.workers"=>8, "pipeline.batch.size"=>125, "pipeline.batch.delay"=>50, "pipeline.max_inflight"=>1000, "pipeline.sources"=>["/usr/share/logstash/pipeline/logstash.conf"], :thread=>"#<Thread:0x57985312 /usr/share/logstash/logstash-core/lib/logstash/java_pipeline.rb:134 run>"}
2023-11-16 14:31:41 [2023-11-16T06:31:41,888][INFO ][logstash.javapipeline    ][main] Pipeline Java execution initialization time {"seconds"=>1.18}
2023-11-16 14:31:41 [2023-11-16T06:31:41,903][INFO ][logstash.javapipeline    ][main] Pipeline started {"pipeline.id"=>"main"}
2023-11-16 14:31:41 [2023-11-16T06:31:41,914][INFO ][filewatch.observingtail  ][main][40685582ea9b96b361405f5a78f0b7757b8c5e1b1cb7fe6256f0ee6a81a58375] START, creating Discoverer, Watch with file and sincedb collections
2023-11-16 14:31:41 [2023-11-16T06:31:41,930][INFO ][logstash.agent           ] Pipelines running {:count=>1, :running_pipelines=>[:main], :non_running_pipelines=>[]}

logs/csv_files*

/usr/share/logstash/pipeline/

Have a good night :slight_smile:

That is not right why is there a star on the folder? And what is inside the folder?

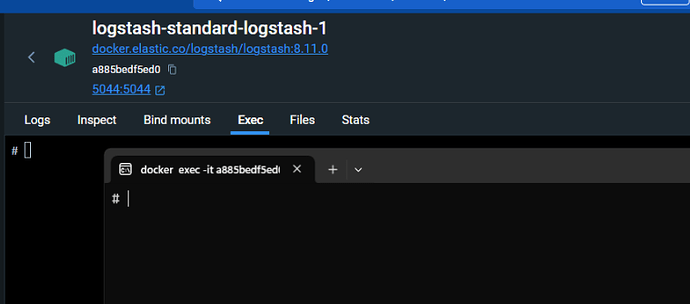
After the exec type
ls -l
pwd

Unix commands? Do you know them?

I typed and got this:

image

There is nothing inside csv_files* folder

Think I found it... Sorry all the windows stuff threw me off.. we put the logs in the / root directory that might not work... sorry.

BUT ... First note there is an extraneous " on the end of the line so that is probably an issue and why it shows up in the images and why logstash can't find the files. (that wont work :slight_smile: )

And Lets change this too

- /d/ATS_Event_Logs/For-Logstash_(ML)/Logstash:/usr/share/logstash/csv_files

so now the files are relative to the logstash directory.

then in the conf file

path => "/usr/share/logstash/csv_files/events2022-01-01.csv"

Then when you exec in do

ls -l

you should see

csv_files

then do

ls -l csv_files

and you should see the files

1 Like

Changes implemented. However, the folder is still empty.
image

docker-compose.yml

version: "3.8"

volumes:
  logstashdata01:
    driver: local

networks:
  default:
    name: elastic
    external: true
    
services:
  logstash:
    image: docker.elastic.co/logstash/logstash:${STACK_VERSION}
    labels:
      co.elastic.logs/module: logstash
    user: root
    environment:
      - xpack.monitoring.enabled=false
    volumes:
      - ./:/usr/share/logstash/pipeline/
      - /d/ATS_Event_Logs/For-Logstash_(ML)/Logstash:/usr/share/logstash/csv_files
    command: logstash -r -f /usr/share/logstash/pipeline/logstash.conf
    ports:
      - "5044:5044"
    mem_limit: ${LS_MEM_LIMIT}

logstash.conf

input { 
    file { 
        path => "/usr/share/logstash/csv_files/events2022-01-01.csv"
        start_position => "beginning" 
        sincedb_path => "/dev/null"
    } 
}

filter { 
    csv { 
        separator => ","
        columns => [ "id","uniqueid","alarm","eventtype","system","subsystem","sourcetime","operator","alarmvalue","value","equipment","location","severity","description","state","mmsstate","zone","graphicelement"] 
    } 
}

output { 
    elasticsearch { 
        index => "ats-logs" 
        hosts => ["https://es01:9200"]
        manage_template => false
        user => "elastic"
        password => "elastic123"
        ssl_verification_mode=> "none"
    }
    stdout{} 
}

Everything looks pretty good

But You need to read about docker volume mounts for Windows

Or move the files to a local drive etc.. move them under the logstash directory... something..
Sorry can really debug your windows file system... I suspect that network drive is an issue.

If you move files etc you need to make sure you line up the volume mounts and the path in the .conf

its not a network drive.
image

my D drive is a secondary & local drive that actually exists in my machine.

If you say move to logstash directory, do you mean
C:\Users\ethan\OneDrive\Documents\docker-env\logstash-standard

The workspace where i spawn my logstash docker container?>

Anyway, looks like i gg feel stuck for now.

Docker Volume Mount For Windows - Docker Desktop for Windows - Docker Community Forums

Side question - but when I Volume Mount my data into my logstash container, will there be any issue with file size limits?