What needs to be clarified? The more specific question you ask the more specific answer you'll get. Right now I have no idea what you're asking or even what the problem is.
Hello magnus Sorry for any confusion .
Actually I have modified certain things to speed up logging things .
This is my code to generate more than 1 Gb file. Now I am not using Nlogger anymore
static void Main(string[] args)
{
Stopwatch sw = Stopwatch.StartNew();
string folderName = @"D:\Log";
string jobId = System.Guid.NewGuid().ToString();
jobId = jobId + "\MIPS";
string pathString = System.IO.Path.Combine(folderName, jobId);
System.IO.Directory.CreateDirectory(pathString);
        string fileName = "Mipslogger.log";
        pathString = System.IO.Path.Combine(pathString, fileName);
        using (System.IO.FileStream fs = System.IO.File.Create(pathString))
        {

        }
        using (System.IO.StreamWriter file =
       new System.IO.StreamWriter(pathString))
        {
            for (var line = 0; line < (200000000 + ( 100)); line++)
            {
                file.WriteLine("MIP : " + line);
            }
        }
        sw.Stop();
        Console.WriteLine("Time taken: {0}ms", sw.Elapsed.TotalMilliseconds);

    }
This is my config file .for logstatsh
input {
file{
path => "D:/Log//MIPS/"
start_position => "beginning"
sincedb_write_interval => 0
}
}
filter{
mutate{
gsub => ["path","D:/Log/", ""]
}
}
output {
stdout {
codec => line {
format => "%{path}"
}
}
}
Below are the timing info I am getting
30752ms (without logstash running with log generation)
340478ms (when log is being generated parallel with logstash running)
And I am seeing one the logger file generated logstasth keeps on running to do its filitering .I am facing two issue
You can see sincedb_write_interval is 0 but I am not seeing since db creating for a very long time .
Is there any way I can speed up the logstash processing .I am seeing log file is generated with couple of minutes but logstash keeps on running until i pressed ctrl-c.
Please provide your provide .
Thanks and Regards
Varun
Below are the timing info I am getting
30752ms (without logstash running with log generation)
340478ms (when log is being generated parallel with logstash running)
Ten times slower just because Logstash is monitoring the file? I find that very hard to believe. Wait... you have sincedb_write_interval set to zero. That would probably cause Logstash to rewrite the file after every single read operation. What if you comment out that line?
Again, use Process Monitor to record what going on.
I am seeing log file is generated with couple of minutes but logstash keeps on running until i pressed ctrl-c.
That's by design. Logstash's file input is tailing the file and waiting for more lines to be added. Right now the only way of knowing when Logstash is done with a file is to monitor the sincedb file.
Hello Magnus ,
I agree with your point no 2. But my doubt is sincedb file was not created I have tried keeping sincedb_write_interval 0 and by default also even though I am seeing logstash keeps on running .I am seeing this issue recently only when I am not generating logs with Nlog rather I am generating log and folder with the C# FILE File write operation which I have mentioned above .Please have a look on that thing if possible .and Here are my results when I have removed sinc_db_write file interval from my config file
3Gb File Size
72767.4751ms (without logstash )
96086.1531ms(using with logstash )
Following are the snippets from process monitor

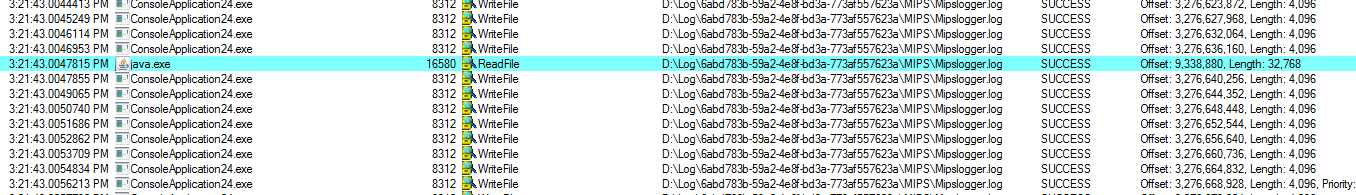


I am seeing there is some delay added by the logstash .
I am seeing there is some delay added by the logstash .
What do you mean? The Process Monitor screen shots you posted show the ingestion rate of Logstash (about 142 kB/s). But what we're interested in is the speed at which ConsoleApplication24.exe can write to the log file, right? In that case the interesting metrics are
a) the duration of each WriteFile request and
b) the time between each Writefile request
with and without Logstash running. Plotting each metric in a histogram would be interesting—is there a tiny slowdown in each write operation, are there outlier latencies, or can we learn anything else?
Hello magnus ,
After a heavy discussion and debugging with Nlog people finally we got some fix for their performance issue .Looking for similar kind of cooperation for logstash also.We have two issues currently .
Can you please check from your side also that does the performance of logging affected when logstash is simultaneously running
The time taken by logstash for parsing is slightly high even though logging has stopped.Logstash keep on running for a long time
Kindly get me resolve this issue with high priority
Thanks and Regards
Varun
I'm afraid I don't have the time and interest to debug Logstash performance on Windows. Seeing the histograms I talked about in my previous post would still be interesting though. Filing a GitHub issue with some concrete data might be a way forward for you.
Hello magnus ,
I have raised a case on github but wont u mind if u can just confirm that have seen this kind pf performance issue earlier or is that i am doing some mistake from my side .
I have raised a case on github
Indeed: [Logstash Performance Issue] · Issue #4318 · elastic/logstash · GitHub
If you want to get any traction with it I suggest you add additional details and benchmarks. I added a link to this thread but it's a good idea to summarize it and, again, supply data.
but wont u mind if u can just confirm that have seen this kind pf performance issue earlier or is that i am doing some mistake from my side .
I've never seen any such performance problems but I've also never run Logstash on Windows.
Hello magnus ,
Thanks for your support.Really appreciate the kind of feedback you have given to me .
Thanks and Regards
Varun
hello magnus ,
I am not sure this is teh right question to ask to you or not but can you tell me In logstash config file I want to redirect in a output in a file whose location is on shared .I am the shared location path in this way
file{
path => "\shared-01\Share\Temporary_Shared_Space\varun"
message_format => "%{message}"
flush_interval => 0
}
But its showing the error
2b0f2125-1775-4ad4-bd84-7ccc720a09b4/MIP/MipLogger.log
Errno::ENOENT: No such file or directory - \shared-01
mkdir at org/jruby/RubyDir.java:458
For new questions please start a new thread.
Try forward slashes instead of backslashes (and make sure you start with a double slash).