Hello everyone,
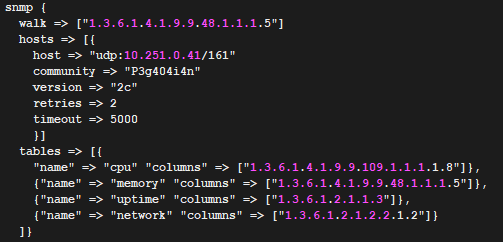
i'm struggling with snmp pipeline here. i have configured the pipeline like below picture. i used walk and define the tables too. when i run the logstash, there is no error log about this pipeline. it's just normal and looks fine, but when i go to kibana discover and then i filter the data to this IP ,the log is missing

i have another entry like this and this works fine. the log from this host continuously popping up on elastic
can you help me to solve this?