i plan to split field into multiple document based on OID. So, i have configured snmp pipeline for my network device. I managed to monitor the cpu and memory usage but i'm facing problem when i want to monitor network traffic on this device. in my pipeline configuration, i already add config like below:
walk => ["1.3.6.1.2.1.2.2.1.2", "1.3.6.1.2.1.2.2.1.10", "1.3.6.1.2.1.2.2.1.16"]
1.3.6.1.2.1.2.2.1.2 is OID for interface name
1.3.6.1.2.1.2.2.1.10 is OID for inbound traffic of the interface
1.3.6.1.2.1.2.2.1.16 is OID for outbound traffic of the interface
After i apply configuration above, the log at elastic look like this:
from the picture above, is it possible if I group the logs by Child OID ? my goal is group the field that have same child into different document. for example:
Field iso.org.dod.internet.mgmt.mib-2.interfaces.ifTable.ifEntry.ifDescr.1 will be in the same document as iso.org.dod.internet.mgmt.mib-2.interfaces.ifTable.ifEntry.ifInOctets.1 and iso.org.dod.internet.mgmt.mib-2.interfaces.ifTable .ifEntry.ifOutOctets.1
but will be in different document with iso.org.dod.internet.mgmt.mib-2.interfaces.ifTable.ifEntry.ifDescr.10
so that way, I can display it in grafana. Can you help me please? Thank you
if you have another idea, please don't hesitate to give it to me. FYI, there are 3 device that i want to monitor
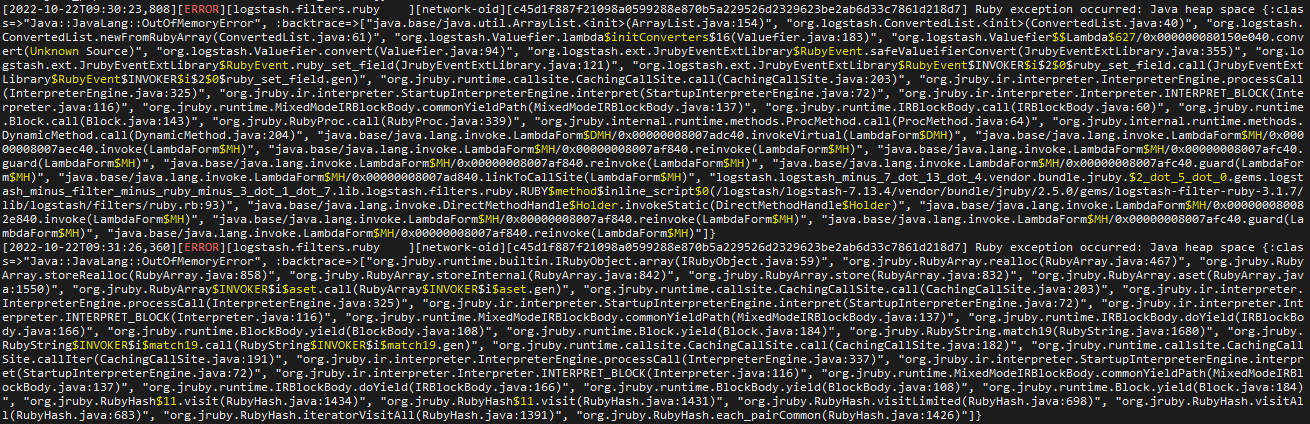
OK, in advance I'm very grateful to you because now the data is in accordance with what I want. but this ruby filter, causes my logstash to get OOM and it's quite often.
I already apply filter like you mentioned before, but it's just drop the log if it has _rubyexception in tags. it doesn't solve OOM error. after i apply that filter, i can still see error log like this:
maybe for your information, My network devices that will be monitored increase to 64 and some of them have 52 interfaces. and my logstash has a 12 gigabyte jvm. do you think i must increase the spec of the logstash? or is there anything else I can do in this pipeline?
Nobody on the internet can solve that problem for you. You need to run the analysis. If you can provide the output of a heap dump analyzer then it is possible someone my be able to help you review it.
If you approve the request for access that I submitted then I will take a look at the dump. The MAT output does not have enough detail to diagnose the problem.
sorry, can you request it again to this link? i didn't receive a request access to this folder. i already upload MAT report and the heap dump file there. Thank you
Yeah, but in the post you deleted there was a different link which required me to request access. I downloaded it and MAT got an error trying to parse it. Is there any chance you could reproduce the problem with a smaller heap size? A 12 GB heap dump may be more than I can handle.
Maybe i will send you a MAT report of the heap dump file later. If you have any instruction or tutorial how to download it. Please share it to me or you can try to change the -Xmx configuration on MemoryAnalyzer.ini file inside mat folder. if your computer or laptop has 16GB of RAM, you can change -Xmx configuration to 11g just like i did before to generate MAT report
Or you can try this link. I got this from heaphero team. I already contact them before to help me to analyzing my heap dump file and they just sent the report today
I didn't really want to do that since it resulted in the JVM growing the memory usage to 15.9 GB and swapping every other program to disk, so that they take 30+ seconds to respond.
That said, it worked and many of those programs will get swapped back into RAM overnight. I'll be back with an analysis in about 14 hours.
MAT only needs about 4 GB to store the analysis, so that's no problem. I was amazed by the level of compression that zip achieved on the heap dump. 150 MB to contain a 12 GB dump. Probably lots and lots of zeroes.
There are two worker threads, each of which has hundreds of millions of references to the same nil object. Each reference retains 40 bytes on the heap.
I have absolutely no clue as to how the ruby filter I suggested could cause that.
is it possible if this is caused due to too much data and insufficient memory? because of the network devices that I monitor, some of them have up to 52 interfaces and I also monitor the inbound and outbound traffic from each interface. so there's a lot of data being sent to elastic and maybe logstash is overwhelmed with organizing that data
Apache, Apache Lucene, Apache Hadoop, Hadoop, HDFS and the yellow elephant
logo are trademarks of the
Apache Software Foundation
in the United States and/or other countries.