If you are using standard index, not customized, you should see data in Kibana Dashboards
http_dashboard.ndjson is only to import the dashboard in Kibana
Do you have a visual? Mobile One, can you copy, please?
OK, I suppressed this file.
I my main dashboard, I use the index = "xconf-qa-*" (like configured in the beats/modules)
In Kibana, I found the dashboard "Heartbeat HTTP monitoring", but it uses "heartbeat-*", then this dashboard doesn't work here. (No matching indices found: No indices match pattern "heartbeat-*")
I made a simple visualisation with axes :
- horizontal : @timestamp
- vertical : http.response.status_code
(I used a wrong address in the file heartbeat.yml to get some "400")
I don't know if this is this visual that you wanted.
This seems to be a good starting point to get a nice graph.
output.elasticsearch:
  hosts: ["edaa...nt.com:9243"]
  protocol: "https"
  username: "xconf-qa-write" # this username must have rights on heartbeat-* index.
  password: "pass"
  ssl.verification_mode: none
  #index: "xconf-qa-%{[agent.version]}-%{+yyyy.MM.dd}"
No need changes on the dashboard "Heartbeat HTTP monitoring"
or
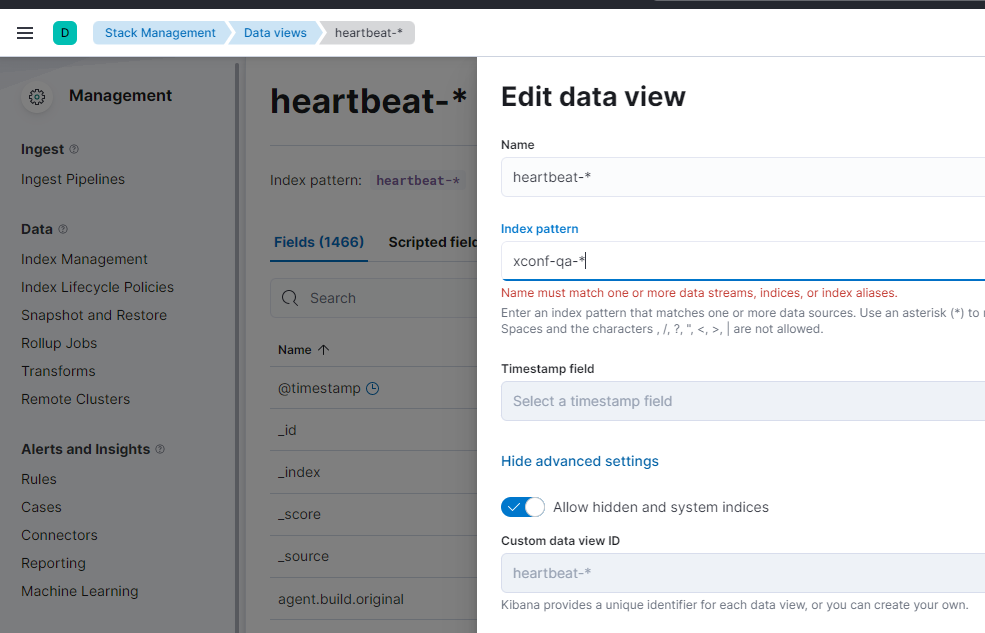
2. Change the data view to show data from Index pattern: xconf-qa-*
or
3. Edit http_dashboard.ndjson and replace index pattern refence with your xconf-qa-* and import the dashboard again "references":[{"id":"heartbeat-*","name":"kibanaSavedObjectMeta.searchSourceJSON.index","type":"index-pattern"},{"id":"heartbeat-*","name":"kibanaSavedObjectMeta.searchSourceJSON.filter[0].meta.index","type":"index-pattern"}]
I would have liked this, but I couldn't find "Dataview" in "Stack management", nor elsewhere (pb of version ? I use 7.16.7, pb of rights ?)
In the file "http_dashboard.ndjson" I replaced "heartbeat-" with "xconf-qa-" twice (in the part of text you showed)
This is OK !!!
I open the dashboard "Heartbeat HTTP monitoring" , and there are no more errors, and the graphs are displaying.
There is just a message " There are too many series defined (56). The configured maximum is 50." but it only concerns the panel " HTTP duration heatmap" that I don't think it will be useful to me.
Apache, Apache Lucene, Apache Hadoop, Hadoop, HDFS and the yellow elephant
logo are trademarks of the
Apache Software Foundation
in the United States and/or other countries.