Hello there,
I wonder whether someone can help me with this
I am looking at ways to load stress test the Logstash service that sits on an ec2 instance
I am looking at implementing some scaling policies for our ASGs but need to stress Logstash and see how it behaves first.
Has anyone done this before ? any particular tool you recommend ?
Logstash performance depends on many factors, the inputs, the filters, the outputs, if you have persistent queues, the specs of the machine and other things like that.
Can you give some more context and share your pipelines?
What i'm looking for is to look at the behaviour of Logstash and determine (as much as i can) what saturation point we have for the resources available to Logstash (at what point does running “low” on CPU start to adversely affect its performance, likewise RAM, disk space, I/O). When we have a view of the thresholds at which we should consider triggering scaling based on the resource we are running low on then we can apply effective scaling policies.
we are currently using a t3.medium ec2
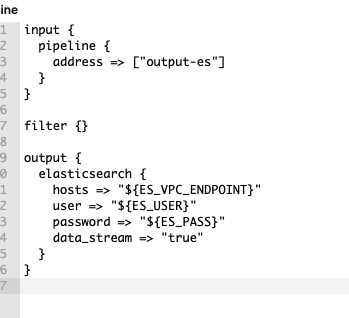
the pipeline settings looks like the below
we have a few pipelines & i'm not sure i can share on here as its for a well known company (Elastic Platinum customer) but to give you an idea ...
2x input pipeline (one for beat and another one for TCP)
input_beat.conf => this pipeline takes input from all beats listening on port 5044 & send it to the distributor.
distributor.conf => this pipeline filter the input based on agent type e.g FB, MB, functionB etc.
then send it to respective pipeline config files e.g filebeat.conf, metricbeat.conf, heartbeat.conf etc
and all of the above are then sent to different output files .... Elasticsearch, s3 buckets etc.
here is a screenshot to give you an idea - hope it makes a little sense to you however this will always vary per customers ... different customers that use our Platform do different things in terms of the data they want to ingest etc.but they all follow this pattern.
I did have a look at the following repo and it was lat updated 6/7 years ago ...
Would this still work ?
The Guide on how to use isn't the clearest either.
just to be precise, i do not mind using a different pipeline config, as long as i can generate a lot of data that is going to stress the Logstash service and see how it behaves with increased load.
This tool is very old and I doubt that it will work in newer versions.
The main issue here is that the performance of your outputs will also impact the logstash performance, so to stress logstash and makes sure that logstash is really the bottleneck of your ingestion and need to be scaled, you would also need to stress the full ingestion process.
For example, if your Elasticsearch can't write fast enough to keep up with the number of events sent from logstash, it will tell logstash to backoff, and logstash will then tell the inputs to backoff as well, but keep in mind that this does not work for all inputs.
Also, sometimes you can improve the performance of Logstash just be making some changings in your filters, I had cases in which just changing a filter dratically reduced the CPU usage.
But If you want to test how fast logstash can process your events, you have some options:
you can use the generator input in another instance to generate data and send it to your logstash using the tcp input for example.
if you want to test the beats input you could output the data from the generator input to a file and configure a filebeat to read from it.
You can also use the http input and use something like JMeter or locust to make requests to this input.
This would at least give you some insights in how fast your logstash can process the events.
Thanks @leandrojmp for your prompt response
I decided to go with Option 1 for now .. i created many input generator config files with some metricbeat, filebeat & tcp payloads.
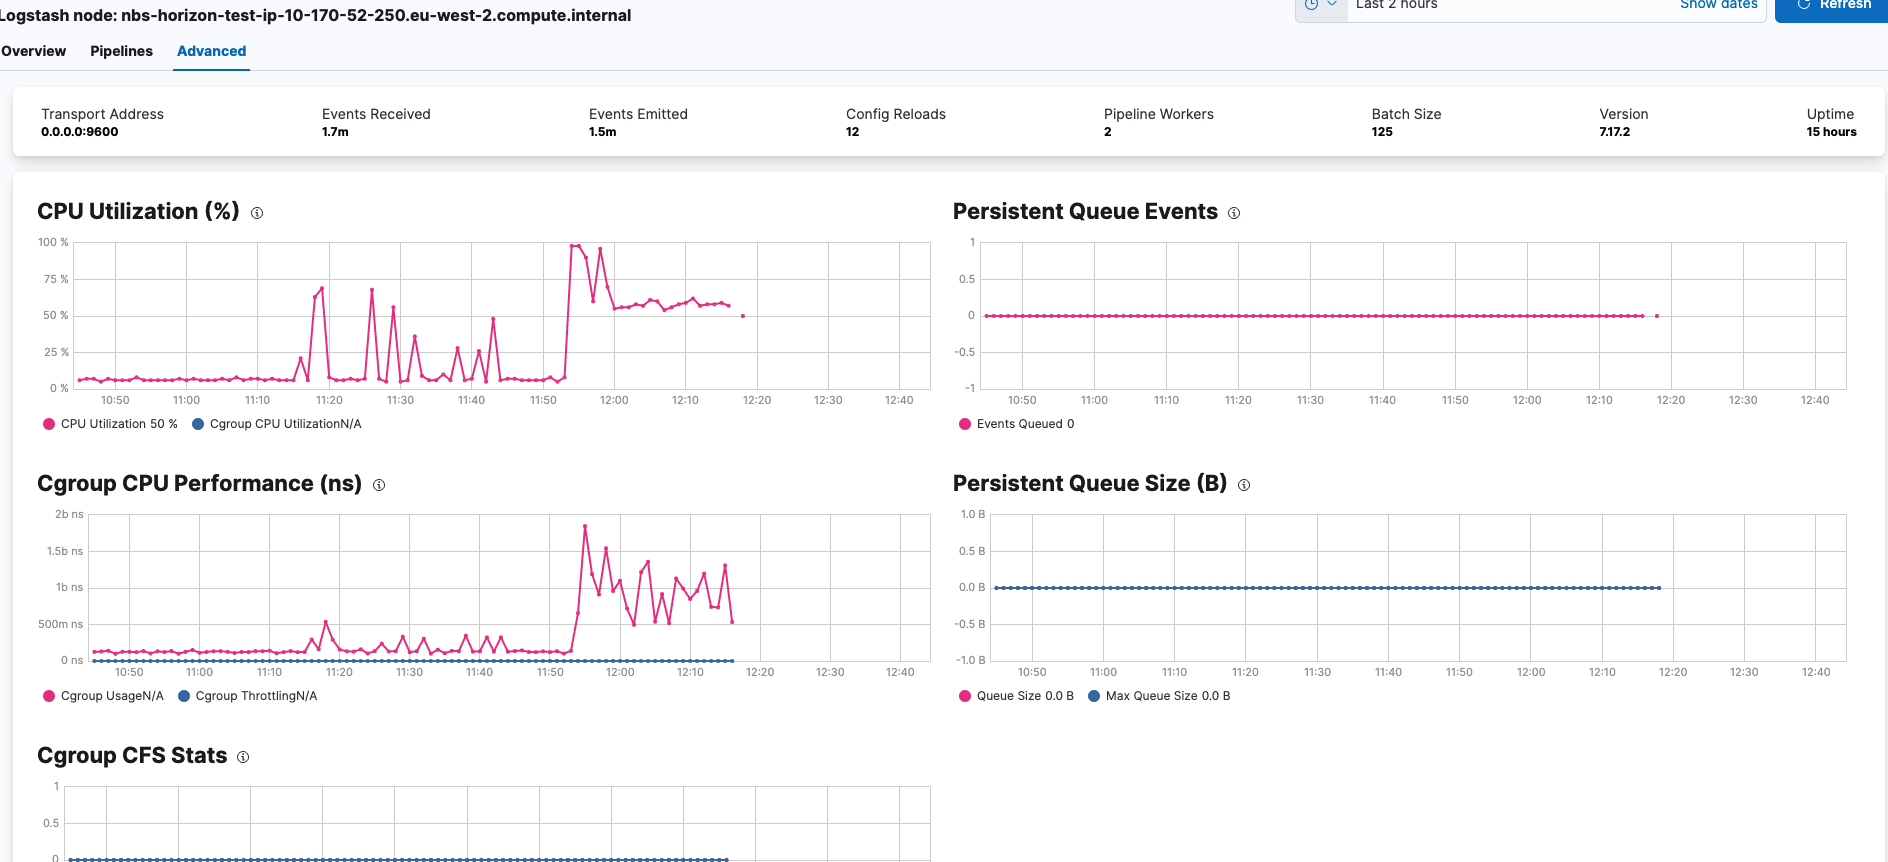
i can see CPU, JVM, Latency etc. spiking but at this stage i am not entirely sure how to go about figuring out where the bottleneck starts & decide at what % for ex CPU% utilisation can start causing issues as ive just been loading a lot of data in ... maybe there is something which i was hoping you can help with.
i can see the dead letter Q for all output to Elasticsearch has definitely maxed out and we can definitely tweak that (any recommendation here?)
The dead letter queue is used for events that cannot be retried by the elasticsearch output in a logstash pipeline, at the moment only events with code 400 and 404 will be sent to the dead letter queue.
There is no tunning in this queue, what you can do is to increase the queue size change the value of dead_letter_queue.max_bytes, but this will not solve the issue, you need to look into those events, see why they are being reject by elasticsearch and solve it, you can use the dea letter queue input to consume those events.
I do not use the deat letter queue, but if I'm not wrong Logstash will stop emitting new events if this queue is full.
As I said, it is very trick to determine if the bottleneck of your ingestion is really Logstash as it is only the middle piece, most of the cases where I had some kind of bottleneck in the ingestion, the cause was in the output, mainly Elasticsearch not being able to write fast enough.
In this example you shared there are probably no issues with your logstash, but with your elasticsearch that was rejecting documents and filling up the logstash dead letter queue.
I would say that you should scale logstash if it is giving you constant ingestion issues like some delays and you were able to track the cause to logstash and not elasticsearch, but I'm not sure how you can stress test Logstash to reach these conclusions.
thank you @leandrojmp very much appreciated !
last & foremost i promise
with the Logstash generator input plugin .. is there a way to control the rate or frequency at which the data is being ingested ?
i was under the impression that the DLQ sometimes referred to as an undelivered-message queue, is a holding queue for messages that cannot be delivered to their destination, for example because the Q is full & will be re-processed once the Q becomes available again at another time.
There is none, but maybe using the filter plugin throttle you can achieve something like that.
The Dead Letter Queue is a queue for events that were rejected by elasticsearch with an response code of 400 or 404, the events in the DLQ will not be reprocessed as they cannot be retried, you can process those events running another pipeline with the dead_letter_queue input plugin, but processing the events will not delete it, you need to manually remove the data by stopping the logstash processing and deleting the files.
Maybe you were confusing it with the Persistent queue? The Persistent queue is a in disk queue to store the events before processing them, by default logstash uses a memory queue for this function.
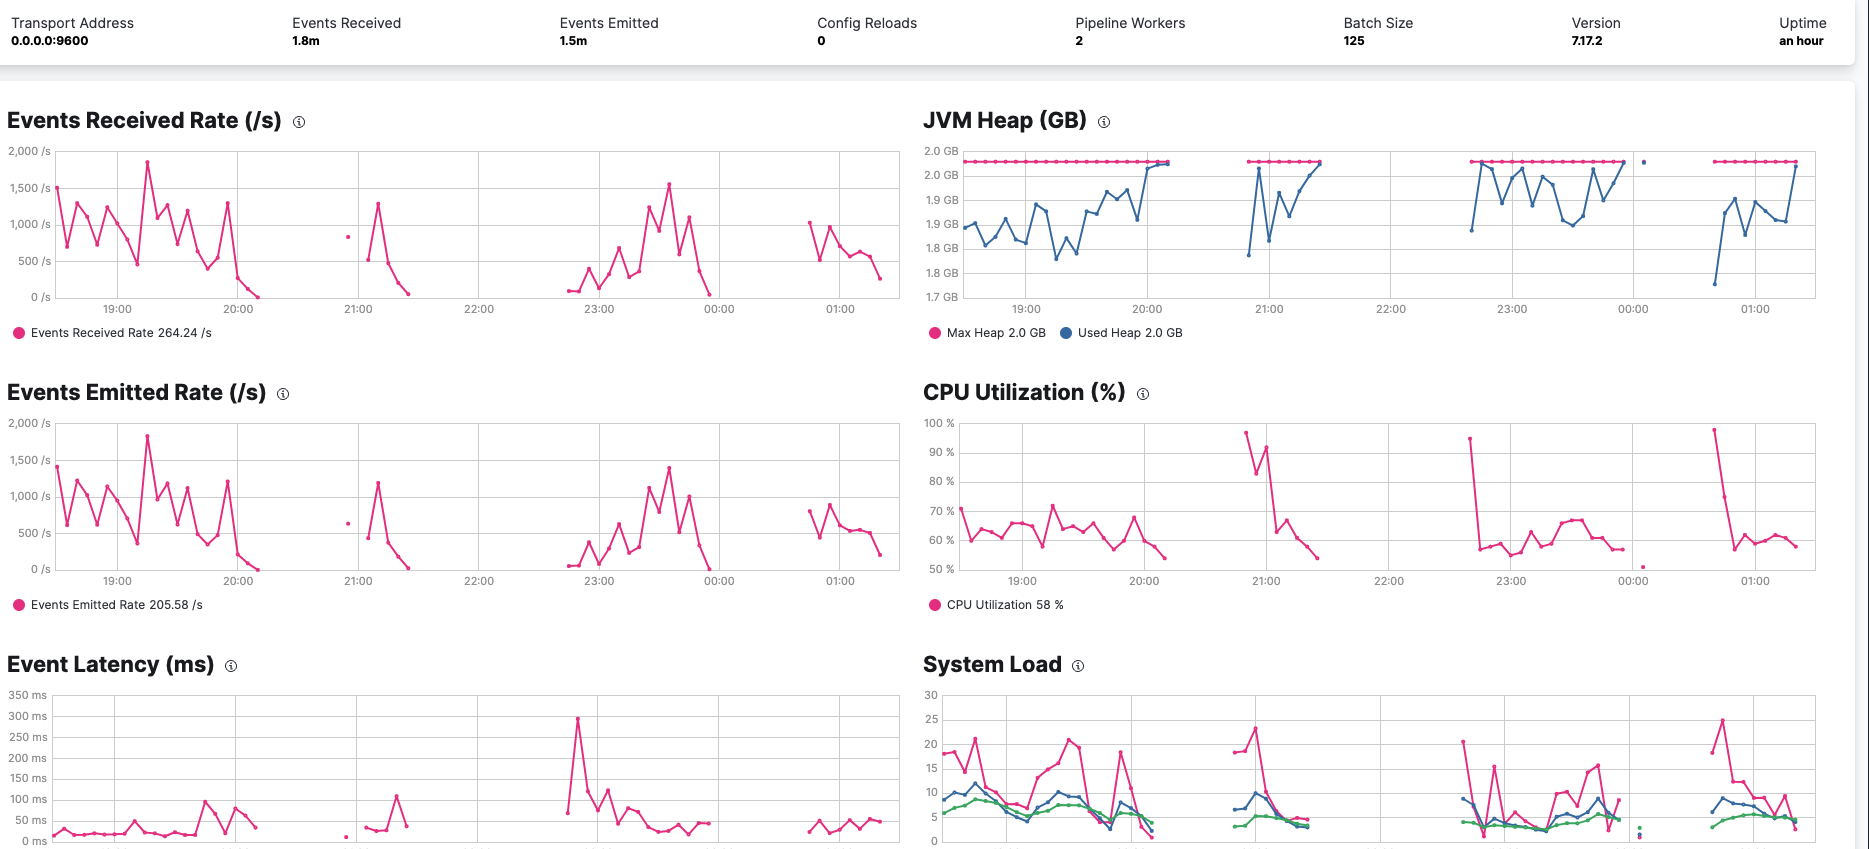
Hello @leandrojmp , i'm having some issues with stressing Logstash, i set up a few generator pipeline config etc but when i look at the Events Received Rate (/s) / Events Emitted Rate (/s) its not a sustained load ... is there a reason why or is there a way to over come this ?
since Logstash is still processing data, why is the line does not appear to be straight ? there is a spike at the beginning of the test but it then drop back down quickly.
It Is the first spike the time when you started the pipeline?
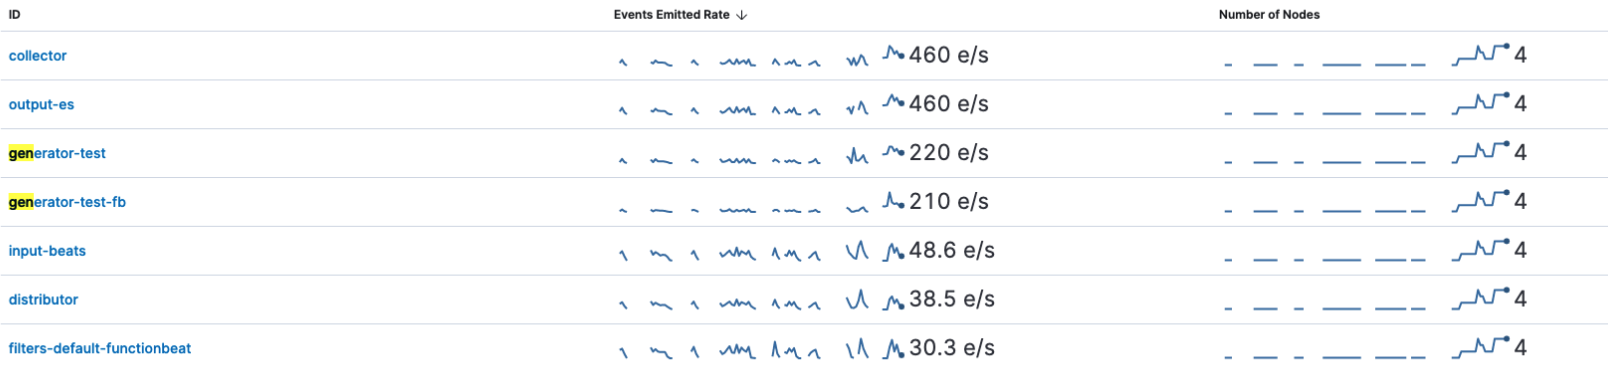
Also, what is the configuration of the collectorPipeline? It is one of the outputs of the pipeline you shared and it can influence in the number of events.
Do you have the same behavior if you remove the pipeline output? Do you have the same behavior if you change the output to stdout? Your memory usage seems to be also in the maximum.
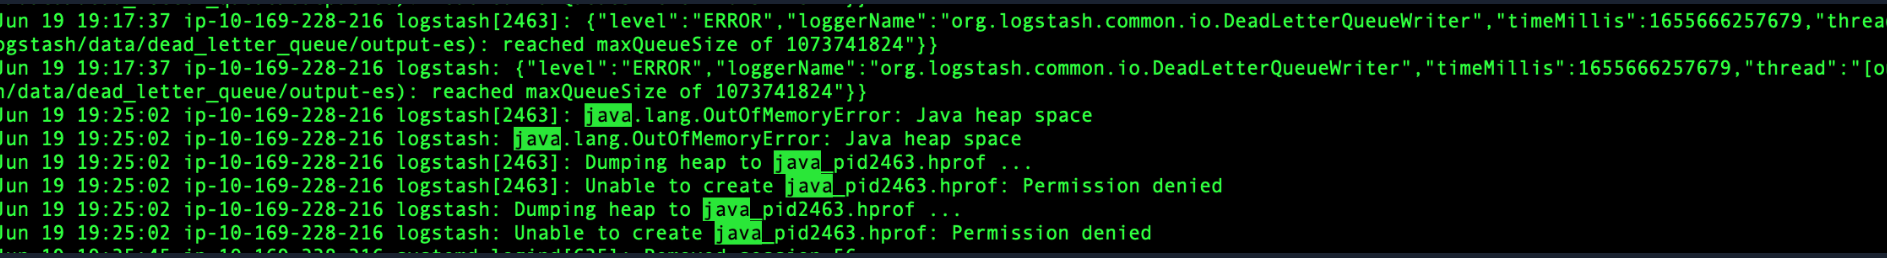
Do you have anything in the logs? I would assume that the other pipeline output is not working as expected and started to block your test pipeline after sometime.
As I said before, I do not perform stress test in Logstash, I prefer to monitor the performance and adapt as needed.
Despite the Events Received Rate (/s) / Events Emitted Rate (/s) dropping, when the tests are still running, the CPU, JVM etc. is still high until the i stop the generator.
I haven't tried to the output to stdout. I am not sure i understand what difference this will make, i am just outputting the same data onto a file on the server where i am testing this just to make sure that the data is still being written (it does)
Your memory usage seems to be also in the maximum >> would this explain why we see the drop ?
The collector & output-es are also the busiest pipeline
on some other cases i can see drops in the data being emitted and its coming back up again then goes down again - hard to explain the lack of data in between.
Since this output is also an output of your test pipeline, this could explain the drop in the events, if your DLQ is full, logstash will stop processing events and your test pipeline will stop after some time. It is the same error as you had before. You need to look in the Logstash and Elasticsearch Logs to see why the events are being reject and you also need to empty the DLQ path as it will not empty itself.
If you are running Logstash in the CLI, the stdout will be the console and the logs will not be written anywhere, this would help to see if your hard disk is an issue as a slow disk can also impact the performance and the number of events, but if you are running Logstash as a service, this would not change much as the stdout would then write the syslog file.
Could be, are you running Logstash as a service? If yes, those gaps in monitoring could indicate that Logstash could not answer the request for the metricbeat collector.
You want to stress logstash, but with your configurations you are testing the performance of both your Logstash and Elasticsearch, also, your elasticsearch is rejecting your documents, this will make logstash fill the DLQ and when the DLQ is full, it will starting logging a lot, which will put a load on the service.
Try to remove every other output besides the file output in your generator pipeline, do not output to elasticsearch, and check the event rate.
Apache, Apache Lucene, Apache Hadoop, Hadoop, HDFS and the yellow elephant
logo are trademarks of the
Apache Software Foundation
in the United States and/or other countries.