I am getting the logs on kibana dashboard using logstash pipeline for syslog, authlog and nginx and all the fields are also showing on kibana dashboard like system.auth.ssh.geoip.country_name, system.auth.ssh.geoip.continent_code etc for authlog as well as nginx logs.
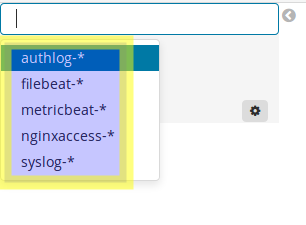
I have created separate template for each index and created separate indexes for auth.log, syslog and nginx access log. My template name are authlogs, syslog and nginxaccess
Below are the index patterns and templates names are also same:
In filebeat-* index we are getting only our application logs.
I have created separate index for each log type so we can create separate dashboard for each log type with required field.
When we use single index for all logs then we create separate dashboard for each log type with required filed then dashboard showing blank line if selected filed data didn't match.
Can you please tell me how i can fix this issue?
One more question, if i use filebeat-* index for my auth.log, syslog and nginx access logs then i will able to see the data on Filebeat syslog and nginx dashbord. I am right?
I am using ELK 6.4.0 as well as beat (Filebeat, Metricbeat) 6.4.0
I am not using filebeat modules, because i am using logstash and filebeat modules can't be used with logstash. i am using prospectors in filebeat and then logstash pipeline to ingest data.
There is one problem using filebeat-* index for auth.log, syslog and nginx logs i.e all logs will be come in single index and even if we create separate dashboard on the basis of fields it will still show blank lines in each newly created dashboard. Which make searching difficult.
From above communication its seems that I don't have any other option now except by using filebeat-* index for authlog and nginx log if i want to use filebeat dashboard of syslog and nginx.
If you can suggest any alternative that will be good for me.
Thanks.
You can edit the dashboard files before you upload it to Kibana. Change "index": "filebeat-*" to "index": "{{ your-index-name }}" in the dashboard JSONs provided by Filebeat. Then upload the dashboard again.
I have made changes at my end. Now i am using filebeat-* index for auth.log, syslog and nginx logs and now data is showing in Filebeat syslog and Nginx dashboard.
Apache, Apache Lucene, Apache Hadoop, Hadoop, HDFS and the yellow elephant
logo are trademarks of the
Apache Software Foundation
in the United States and/or other countries.