For #2
We usually go to the transaction page to find the request method, but this page does not have error information, and the error page does not display the request method name. There is no association between the two and it is very troublesome to use
For #1, what I think is happening is that the trace sample is not updated. The rest of the data should reflect the filters you have chosen. We have an open issue for this in the backlog: https://github.com/elastic/kibana/issues/67744.
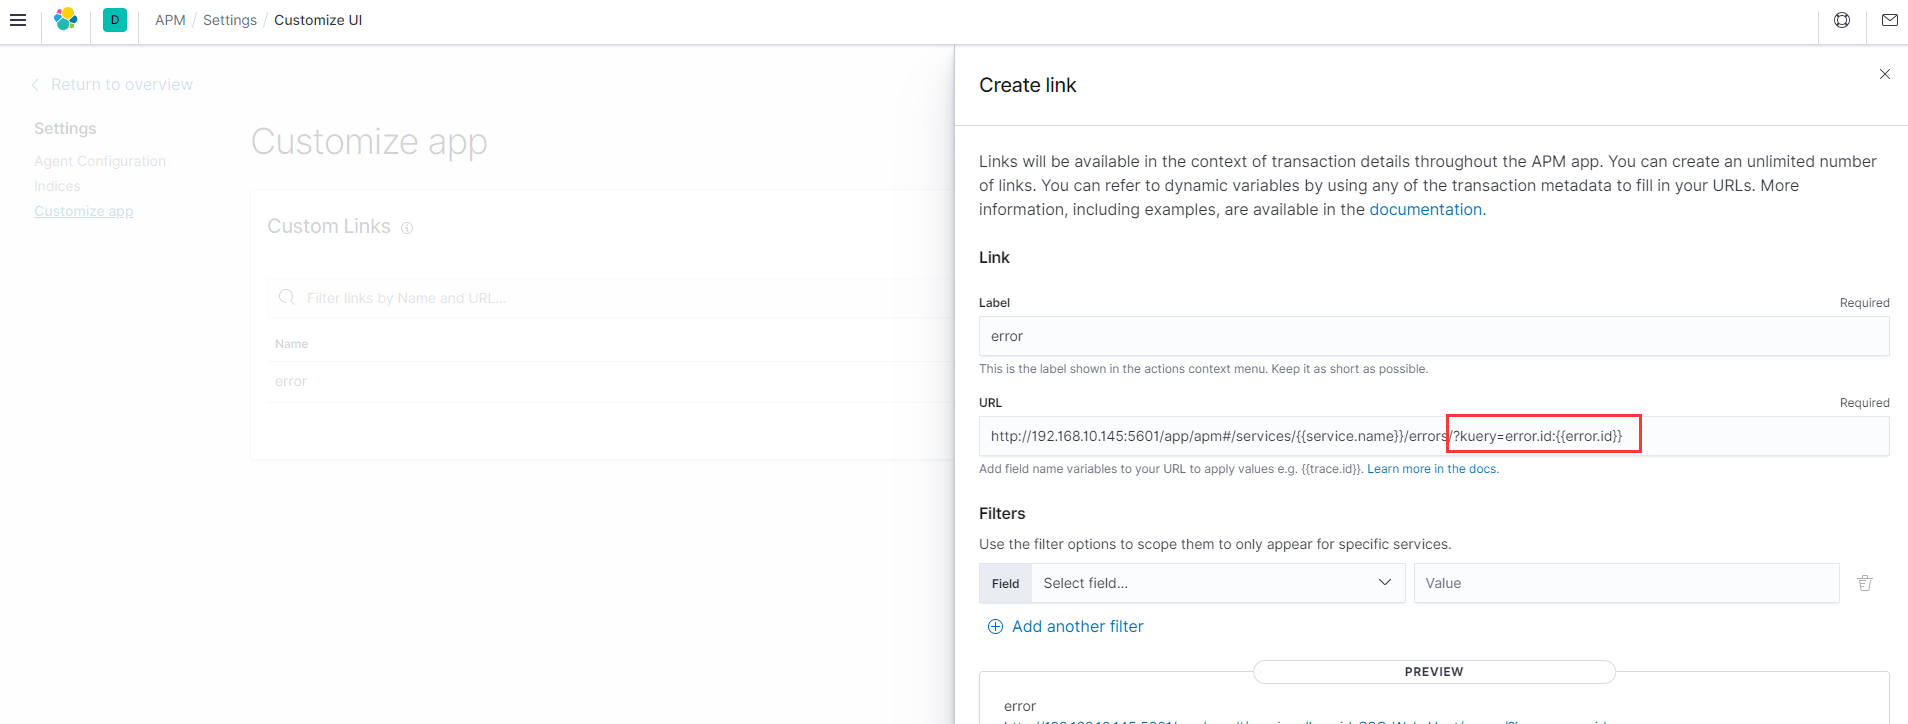
For #2, you can click through to the related errors. You can click on the square on the timeline, or on "1 error" after the transaction name. Would that help? You can also use the query bar in the errors view to search for certain errors, e.g. by specifying "request.method:GET".
For #1
if it is an unresolved bug, then I will leave it alone for now.
For #2
Too many operations will bring a certain learning cost, I think the simpler the operation, the better.
But this depends on the judgment of the elastic team.
In another case, if the error page contains a lot of content, how can I find the error content corresponding to the request method in the transaction page? @dgieselaar
For example, if I am looking for POST CallCenter/InCall information, I can find it when I enter the transaction page. If I want to find error information, the interface information is not displayed on the error page.
If there are many errors on the error page, it is difficult to quickly find the information generated by POST CallCenter/InCall.
Apache, Apache Lucene, Apache Hadoop, Hadoop, HDFS and the yellow elephant
logo are trademarks of the
Apache Software Foundation
in the United States and/or other countries.