Hello guys.
I have set a elastic search and kibana to receive some syslogs from our OnPrem server.
When I go to the discover section and set the time range to refresh every second. I got the warning This interval creates too many buckets to show in the selected time range, so it has been scaled to 10 minutes
But the syslogs coming from OnPrem servers are coming on a range of milliseconds.
In my logstash I can see that the timestamp is refereshing every minute at best, which mean I am loosing some syslogs.
Can anyway enlighten me on this issue please and help me to understand how can I make the refresh to work on milliseconds basis please?
If so, you must know that's only for the graph to show that level of granularity: it will attempt to present 1 bar per second. When the selected time period is too long, 1 second will create too many splits in the graph, and that's why that warning is shown.
If you're after the list in discover to be refreshed (aka, bring more recent data) on every second, you can use the Time Picker to do so:
@afharo
Thank you so much for your reply. Yes I did set the refresh rate at 1 second as you said. but I am still getting the same issue.
Further more, in the quick select I choose last 15minutes and refresh every second..but my data is still refreshing every 10minutes.. so I am able to see the data only after 10min..and the data it shows is about 1sec between each value.
Error: Batch request failed with status 0
    at search_interceptor_EnhancedSearchInterceptor.handleSearchError (http://localhost:5601/39457/bundles/plugin/data/data.plugin.js:8:174193)
    at t.selector (http://localhost:5601/39457/bundles/plugin/dataEnhanced/dataEnhanced.plugin.js:2:29905)
    at t.error (http://localhost:5601/39457/bundles/kbn-ui-shared-deps/kbn-ui-shared-deps.js:436:94299)
    at t._error (http://localhost:5601/39457/bundles/kbn-ui-shared-deps/kbn-ui-shared-deps.js:436:134260)
    at t.error (http://localhost:5601/39457/bundles/kbn-ui-shared-deps/kbn-ui-shared-deps.js:21:58213)
    at t._error (http://localhost:5601/39457/bundles/kbn-ui-shared-deps/kbn-ui-shared-deps.js:21:58519)
    at t.error (http://localhost:5601/39457/bundles/kbn-ui-shared-deps/kbn-ui-shared-deps.js:21:58213)
    at t._error (http://localhost:5601/39457/bundles/kbn-ui-shared-deps/kbn-ui-shared-deps.js:21:58519)
    at t.error (http://localhost:5601/39457/bundles/kbn-ui-shared-deps/kbn-ui-shared-deps.js:21:58213)
    at t._error (http://localhost:5601/39457/bundles/kbn-ui-shared-deps/kbn-ui-shared-deps.js:436:134260)
I think I'm not clear on what you mean by refresh.
Here are some key concepts I think that will help here:
Discover is supposed to show all the entries in your index individually. It doesn't apply any sort of aggregations in your data (i.e.: grouping the items per timeframe).
Selecting Refresh every in the TimePicker will only change the frequency Kibana automatically fetches the data from Elasticsearch.
On the chart, changing the granularity from Auto to any other will only affect the bar-chart on top, not the table below.
In any case, the Refresh options in Kibana only affect how often the view fetches the data from Elasticsearch, but if 100s of entries occurred in that period, they'll be shown because Kibana does not store any information itself. All the info is alway consumed from Elasticsearch.
If you think that you might be dropping syslog entries on their way to Elasticsearch, I think that you need to look the configuration in Logstash/Elasticsearch.
@afharo
I am so sorry if I didn't make clear my point, but I am totally new to ELK.
My expectation is to see all the syslog coming in, in real time. Let me explain in details what I mean.
The onprem server sends tons of syslog on a specific port. I configured logstash.conf to listen to that port. Now is onPrem sends 100s of syslog data in 1 second, I would like to see all those data displayed matching the millisecond.
But what I am seeing now is, even if the onprem sends 100s od syslog data a second, in my kibana i am seeing only 3 hits every 5min(as I showed in the attachment)
Please please, and I do apology for the basic question, can you just address me on what should I do to see all the data syslog streamed in real-time?
Thank you! I understand it much clearer now. It definitely looks to me like there might be some misconfiguration in Logstash, and it might be dropping many entries. I've changed the category of this discuss entry so my colleagues from Logstash can help.
I think, in preparation to that, it might be helpful if you could share your logstash configuration (feel free to redact any info you might feel PII).
I might need to ask you another info and help regarding kibana if it is possible. in my kibana terminal, I keep getting this error after I run the kibana.bat:
[error][dataEnhanced][data_enhanced][plugins] Error while deleting async_search FlZiaEVnWUhaUXZHdHJOY2FRRlpybWcfV2ZleUdrUFhTbjJTbG10UkdJeHM3dzoxMTE1OTIzMg==: resource_not_found_exception

[error][client][connection] Error: write ECONNABORTED
    at afterWriteDispatched (internal/stream_base_commons.js:156:25)
    at writeGeneric (internal/stream_base_commons.js:147:3)
    at Socket._writeGeneric (net.js:785:11)
    at Socket._write (net.js:797:8)
    at writeOrBuffer (internal/streams/writable.js:358:12)
    at Socket.Writable.write (internal/streams/writable.js:303:10)
    at ServerResponse._writeRaw (_http_outgoing.js:349:17)
    at ServerResponse._send (_http_outgoing.js:325:15)
    at ServerResponse.end (_http_outgoing.js:820:10)
    at PassThrough.onend (internal/streams/readable.js:684:10)
    at Object.onceWrapper (events.js:421:28)
    at PassThrough.emit (events.js:315:20)
    at endReadableNT (internal/streams/readable.js:1327:12)
    at processTicksAndRejections (internal/process/task_queues.js:80:21)
any hint about this please? so sorry for the thousands questions.
@Lukas thank you so much for your help and time.
I followed your instruction and pointed the logs to my logstash.
But I am having the same issue as in the discovery, my logs get refreshed every 2mins rather than in real time. and I get a lot of those failed to find message
@Hamza_El_Aouane I suspect what is happening here is that the text CUSTOM GROK HERE in the grok_pattern is stopping the grok match, which means that the priority and timestamp fields won't be populated correctly. The CUSTOM GROK HERE should be replaced with whatever matches the format of your log entries.
Do you have any error logs in your logstash instance? If you search for documents in Elasticsearch, do you see documents with the tag _grokparsefailure_sysloginput - this gets added when grok matching fails when grok_patterns are specified in the syslog input.
What does your log line look like as it comes from syslog? For example, a log line that looked like:
but would not populate the priority and timestamp fields, and tag with _grokparsefailure_sysloginput when using the grok_pattern that you specify in your config.
@Hamza_El_Aouane The atypical was an example - you shouldn't need that in your grok_pattern - "<%{POSINT:priority}>%{SYSLOGTIMESTAMP:timestamp}"is likely sufficient
@RobBavey so I removed the atypical and restarted logstash again. Everything seems to be fine, Exept for the fact that still the log I am receiving are not in real time. They keep coming every 2 mins even if I am in the observabikity=>logs=>elasticsearch logs
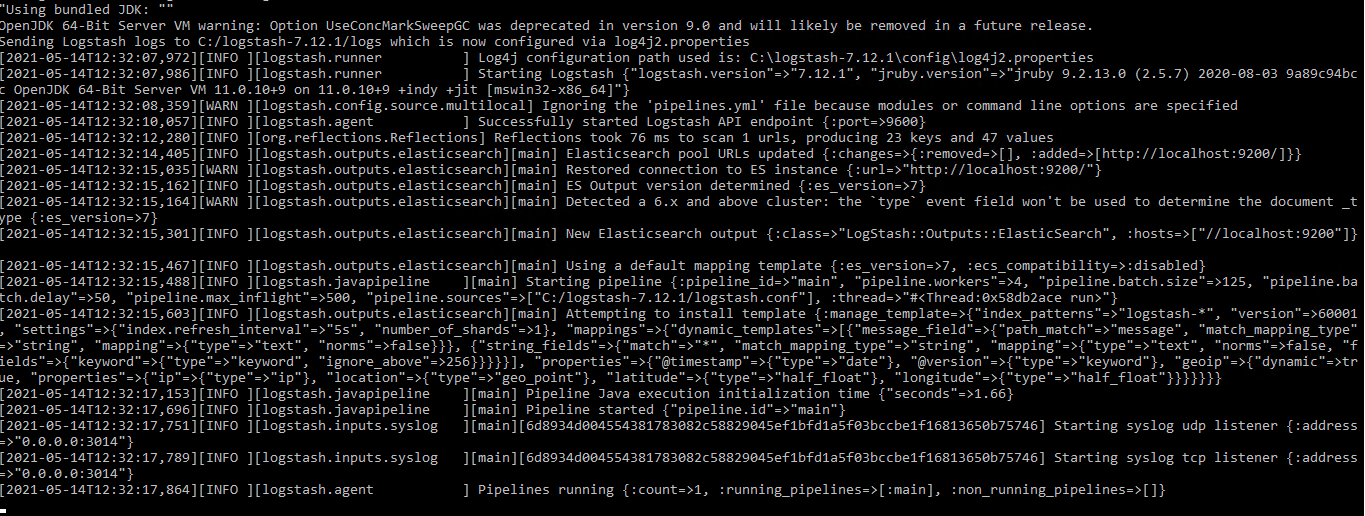
@RobBavey@Lukas I did some more digging. and as kibana kept crushing on me due to the error showed in the previous screenshot, I narrowed the problem to logstash.
@RobBavey in one of your previous request, you asked me about the tags, now I can see the, and yes, the is a grok parse failure on all the entries.
@Hamza_El_Aouane Are you still seeing the failure tags for new events? Or is the grok parse failure still happening?
If it is still happening, we'll need to figure out the appropriate grok pattern that will enable your log to be ingested. Can you describe your setup - how is data being pushed into Logstash, and post a sample log line (removing any sensitive information from your log line)
Thanks for the info - how are you pushing the logs from ArcSight to your logstash node? I'm not 100% familiar with ArcSight, but looking at your message, I don't see any syslog content - the tcp input might be more appropriate - what happens if you do the following:
Apache, Apache Lucene, Apache Hadoop, Hadoop, HDFS and the yellow elephant
logo are trademarks of the
Apache Software Foundation
in the United States and/or other countries.