Kibana version: 7.13.2
Elasticsearch version: 7.13.2
APM Server version: 7.13.2
APM Agent language and version: APM-RUM 5.8.0
Browser version: Chrome 91.0.4472.114
Original install method (e.g. download page, yum, deb, from source, etc.) and version: Downloaded from the elastic page.
Fresh install or upgraded from other version? Fresh
Is there anything special in your setup? No, just activated Rum in the server config.
Description of the problem including expected versus actual behavior. Please include screenshots (if relevant):
Hi everyone,
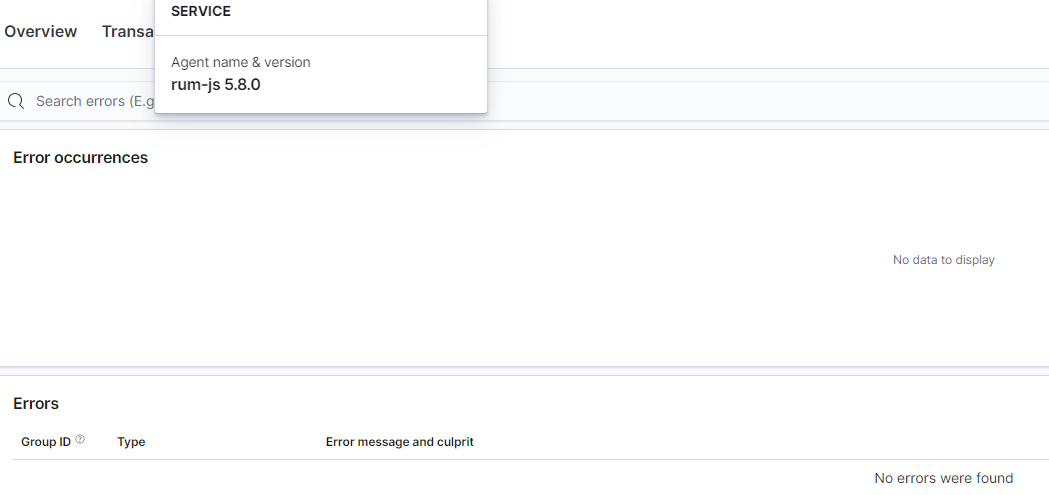
I was wondering if I have to configure something in advance to track all JS errors in my AngularJS application? The rum agent only collects HTML-clicks and transactions.
Thanks in advance.
Errors in browser console (if relevant):
