Transaction.mark() does not show up in the timeline for RUM data

If you are asking about a problem you are experiencing, please use the following template, as it will help us help you. If you have a different problem, please delete all of this text :slight_smile:

TIP 1: select at least one tag that further categorizes your topic. For example server for APM Server related questions or java for questions regarding the Elastic APM Java agent.

TIP 2: Check out the troubleshooting guide first. Not only will it help you to resolve common problems faster but it also explains in more detail which information we need before we can properly help you.

Kibana version: 7.7.1

Elasticsearch version: 7.7.1

APM Server version: 7.7.1

APM Agent language and version: Angular 1.1.3

Browser version:

Original install method (e.g. download page, yum, deb, from source, etc.) and version: Windows zip file

Fresh install or upgraded from other version? Fresh INstall

Is there anything special in your setup? For example, are you using the Logstash or Kafka outputs? Are you using a load balancer in front of the APM Servers? Have you changed index pattern, generated custom templates, changed agent configuration etc. NO

Description of the problem including expected versus actual behavior. Please include screenshots (if relevant):

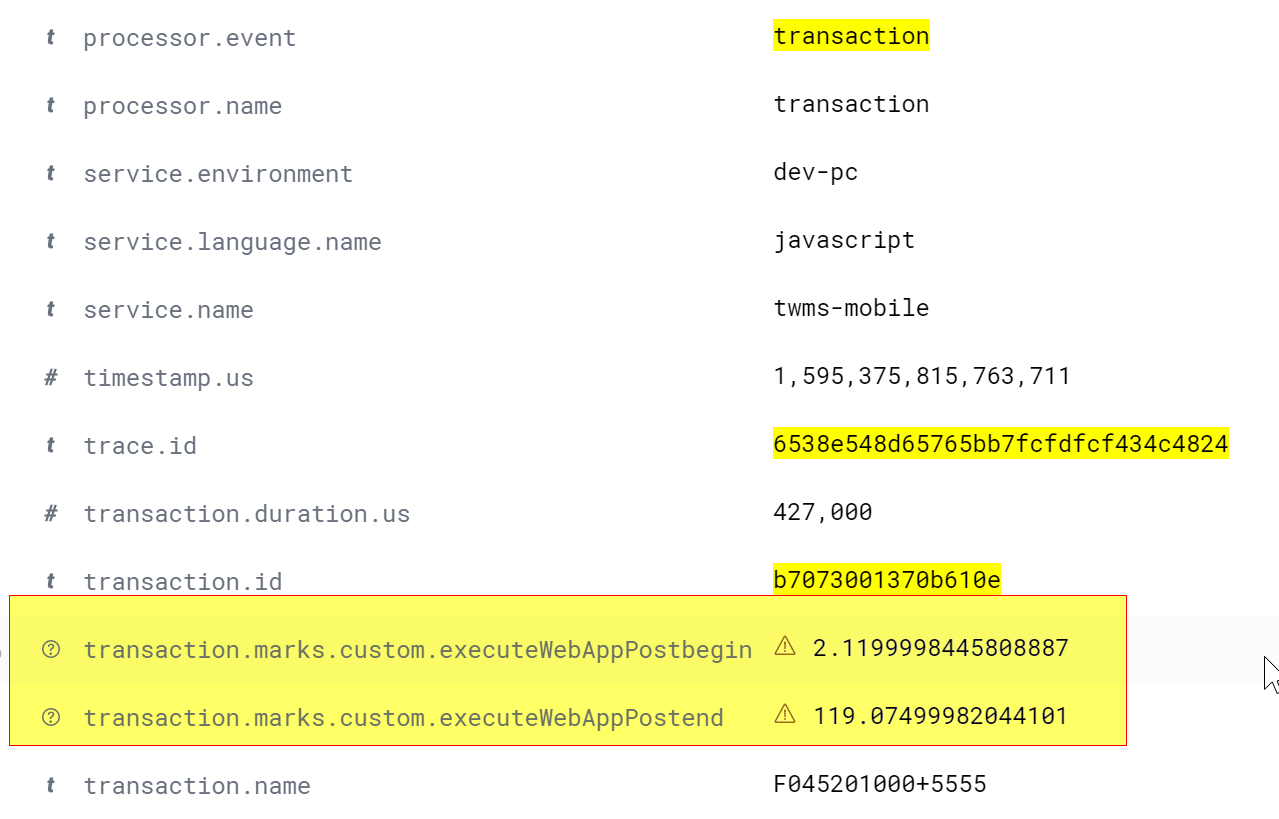
I have added some transaction marks for managed custom transactions. It does not show up on the timeline view like I expected it to (should have been a vertical line). It is part of the transaction data though as I can see in the document.

Is there something I need to enable for it to display in the timeline view?

Steps to reproduce:

  1. For a managed custom transaction add a transaction.mark with a key.
  2. Navigate to APM in kibana and look into the transaction timeline.
  3. The marks are missing which should have been vertical lines in the timeline view.

Errors in browser console (if relevant):

Provide logs and/or server output (if relevant):

Hi @Kartheek_Mannepalli

The custom marks set by the user will not be shown on the APM UI Timeline. Currently the RUM agent only sets the below marks

  • timeToFirstByte
  • domInteractive
  • domComplete
  • firstContentfulPaint
  • largestContentfulPaint

in the correct agent field which will be visible in the Kibana timeline. However you can track the progress of the issue https://github.com/elastic/apm-agent-rum-js/issues/821 which would help with your use case.

For your current usecase, you can use the https://developer.mozilla.org/en-US/docs/Web/API/Performance/measure User timing API which would help you to capture the whole duration of executeWebPost as span in the timeline.

Let us know if you need any help

Thanks,
Vignesh

Hi @vigneshshanmugam

Thank you for your response. Having the transaction marks show up as vertical lines on the timeline will be very useful as our timeline already has lot of spans.

Having said that https://github.com/elastic/apm-agent-rum-js/issues/821 talks about user timing marks being used as transaction marks. Can we expect custom transaction marks to show up in the transaction timeline view once this is resolved and released?

I did give the User timing API a try and I see the data in the console logs but not in elastic APM. Is there something I need to enable for it to show up as spans in the timeline? This is how performance.measure shows up in the console logs but I don't see this data in elastic. (I added the performance.measure inside an existing custom transaction).

image

Assuming the User Timing API works and shows up in the timeline as spans, will this be any different from the custom spans we create within a transaction?

Hi @Kartheek_Mannepalli,

Can we expect custom transaction marks to show up in the transaction timeline view once this is resolved and released?

Yes it should be case, however the APM UI has to have a toggle button to show agent vs custom marks as there might be too many marks that would clutter the UI.

All the Performance related metrics will only be tracked for managed transactions and not for the custom transactions as we do not want to add any spans/metrics that users might not expect in the first place for custom ones. If you want to see these metrics for the custom, you can set managed flag to true in options Agent API | APM Real User Monitoring JavaScript Agent Reference [master] | Elastic

Hope this helps.

Thanks,
Vignesh

This topic was automatically closed 20 days after the last reply. New replies are no longer allowed.