abcfy2
March 4, 2016, 6:10am
1
I install the PostgreSQL from official repo on Ubuntu 14.04 LTS. Here is the postgresql config(Almost keep the default, but remove the comment lines.)
# cat /etc/postgresql/9.4/main/postgresql.conf
data_directory = '/var/lib/postgresql/9.4/main'
hba_file = '/etc/postgresql/9.4/main/pg_hba.conf'
ident_file = '/etc/postgresql/9.4/main/pg_ident.conf'
external_pid_file = '/var/run/postgresql/9.4-main.pid'
listen_addresses = '*'
port = 5432
max_connections = 100
unix_socket_directories = '/var/run/postgresql'
ssl = true
ssl_cert_file = '/etc/ssl/certs/ssl-cert-snakeoil.pem'
ssl_key_file = '/etc/ssl/private/ssl-cert-snakeoil.key'
shared_buffers = 128MB
dynamic_shared_memory_type = posix
log_line_prefix = '%t [%p-%l] %q%u@%d '
log_timezone = 'PRC'
stats_temp_directory = '/var/run/postgresql/9.4-main.pg_stat_tmp'
datestyle = 'iso, mdy'
timezone = 'PRC'
lc_messages = 'en_US.UTF-8'
lc_monetary = 'en_US.UTF-8'
lc_numeric = 'en_US.UTF-8'
lc_time = 'en_US.UTF-8'
default_text_search_config = 'pg_catalog.english'
log_min_duration_statement = 500
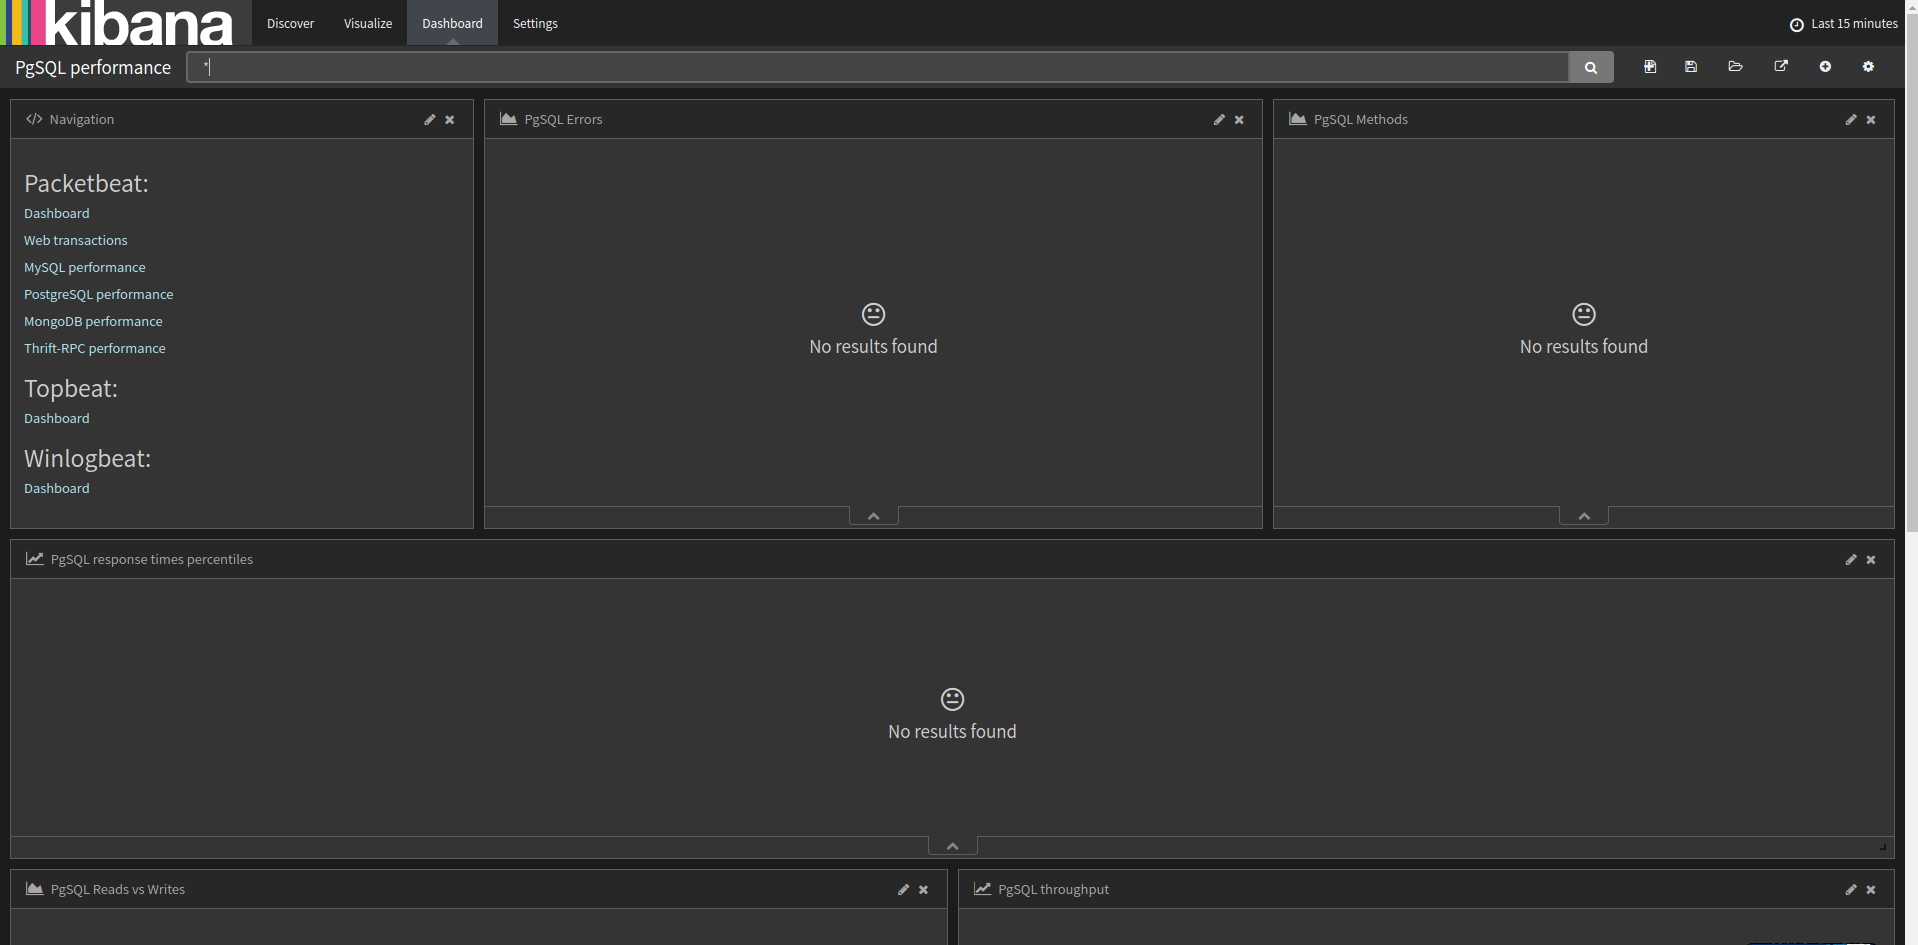
But kibana cannot show any PostgreSQL performance, but mongodb works.
steffens
March 4, 2016, 11:53am
2
How do clients connect to postgres? unix-socket, TCP or TCP+SSL? Packetbeat is a passive network sniffer and therefore requires plain TCP.
abcfy2
March 4, 2016, 12:01pm
3
Both TCP and unix-socket. Maybe ssl is enabled, because ssl = true in postgresql.conf.
steffens
March 4, 2016, 12:08pm
4
SSL will be a problem.
Maybe you can try with postgres client to connect via plain TCP (e.g. check with wireshark/tshark/tcpdump it's really plain TCP) and see problem persists. For sniffing unix-sockets or SSL one basically needs some kind of proxy, which packetbeat is not.
abcfy2
March 4, 2016, 12:28pm
5
I've delete the 3 lines about ssl, but kibana also show nothing about postgresql.
show all;
 ssl                                 | off                                      | Enables SSL connections.
 ssl_ca_file                         |                                          | Location of the SSL certificate authority file.
 ssl_cert_file                       | server.crt                               | Location of the SSL server certificate file.
 ssl_ciphers                         | HIGH:MEDIUM:+3DES:!aNULL                 | Sets the list of allowed SSL ciphers.
 ssl_crl_file                        |                                          | Location of the SSL certificate revocation list file.
 ssl_ecdh_curve                      | prime256v1                               | Sets the curve to use for ECDH.
 ssl_key_file                        | server.key                               | Location of the SSL server private key file.
 ssl_prefer_server_ciphers           | on                                       | Give priority to server ciphersuite order.
 ssl_renegotiation_limit             | 0                                        | Set the amount of traffic to send and receive before renegotiating the encryption keys.
I've turned off ssl, but this issue still persists.
steffens
March 4, 2016, 1:02pm
6
can you check with tshark/wireshark if you can sniff any traffic?
abcfy2
March 4, 2016, 1:42pm
7
How to use? Use which command? I have no GUI on my server, just use SSH.
steffens
March 4, 2016, 2:45pm
8
without gui you can use tcpdump or tshark to check network packets being available. With tcpdump you can also write packets to file and insepect file from within wireshark.
abcfy2
March 5, 2016, 4:58am
9
I find this post
By using this command:
tcpdump -i any -s0 -w"trace.pcap" "port 5432"
Here is the trace.pcap
steffens
March 5, 2016, 11:49pm
10
you can inspect the pcap in wireshark.
running pcap with packetbeat test mode:
./packetbeat -e -c packetbeat.yml -N -I ~/Downloads/trace-2.pcap -t -v -d 'publish'
I get some events, for example:
{
  "@timestamp": "2016-03-05T04:56:14.776Z",
  "beat": {
    "hostname": "Steffens-MBP.fritz.box",
    "name": "Steffens-MBP.fritz.box"
  },
  "bytes_in": 52,
  "bytes_out": 60,
  "client_ip": "127.0.0.1",
  "client_port": 50605,
  "client_proc": "",
  "client_server": "Steffens-MBP.fritz.box",
  "count": 1,
  "ip": "127.0.0.1",
  "method": "SELECT",
  "pgsql": {
    "error_code": "",
    "error_message": "",
    "error_severity": "",
    "iserror": false,
    "num_fields": 1,
    "num_rows": 1
  },
  "port": 5432,
  "proc": "",
  "query": "SELECT 1",
  "responsetime": 0,
  "server": "Steffens-MBP.fritz.box",
  "status": "OK",
  "type": "pgsql"
}
Please run packetbeat in debug mode -v -d '*' and share log output + config. Sniffing and decoding seems to work.
abcfy2
March 6, 2016, 5:49am
11
Thanks
packetbeat -e -c packetbeat.yml -N -I trace.pcap -t -v -d '*'
And here is the log .
I'm not changing the default config of packetbeat.
steffens
March 6, 2016, 8:08pm
12
Weird, I'm missing the pgsql events in your logs. Can you run:
packetbeat -e -c packetbeat.yml -N -I ~/Downloads/trace-2.pcap -t -v -d 'publish'
Also run packetbeat -e -c packetbeat.yml -v -d '*' to sniff packets from network.
abcfy2
March 7, 2016, 1:49am
13
# packetbeat -e -c /etc/packetbeat/packetbeat.yml -N -I trace.pcap -t -v -d 'publish'
2016/03/07 01:36:11.285284 publish.go:202: INFO Dry run mode. All output types except the file based one are disabled.
2016/03/07 01:36:11.285588 geolite.go:24: INFO GeoIP disabled: No paths were set under output.geoip.paths
2016/03/07 01:36:11.285768 publish.go:288: INFO Publisher name: shifudaotest
2016/03/07 01:36:11.286225 beat.go:147: INFO Init Beat: packetbeat; Version: 1.1.1
2016/03/07 01:36:11.288703 beat.go:173: INFO packetbeat sucessfully setup. Start running.
2016/03/07 01:36:11.290527 pgsql.go:875: WARN Response from unknown transaction. Ignoring.
2016/03/07 01:36:11.290626 pgsql.go:875: WARN Response from unknown transaction. Ignoring.
2016/03/07 01:36:11.290676 pgsql.go:875: WARN Response from unknown transaction. Ignoring.
2016/03/07 01:36:11.290736 pgsql.go:875: WARN Response from unknown transaction. Ignoring.
2016/03/07 01:36:11.293602 pgsql.go:374: WARN Postgresql Message too short. 58 (length=1). Wait for more.
2016/03/07 01:36:11.293662 pgsql.go:374: WARN Postgresql Message too short. 58 (length=1). Wait for more.
2016/03/07 01:36:11.309933 pgsql.go:875: WARN Response from unknown transaction. Ignoring.
2016/03/07 01:36:11.323170 pgsql.go:875: WARN Response from unknown transaction. Ignoring.
2016/03/07 01:36:11.323249 pgsql.go:875: WARN Response from unknown transaction. Ignoring.
2016/03/07 01:36:11.323283 pgsql.go:875: WARN Response from unknown transaction. Ignoring.
2016/03/07 01:36:11.323315 pgsql.go:875: WARN Response from unknown transaction. Ignoring.
2016/03/07 01:36:11.630358 sniffer.go:359: INFO Input finish. Processed 5444 packets. Have a nice day!
And here is the log of packetbeat -e -c packetbeat.yml -v -d '*'.
But in the trace.pacp file, I could see the express SQL and fields.
steffens
March 18, 2016, 1:21pm
14
Hmm... interesting. I tested with current packetbeat development branch. There are some improvements to the pgsql module.
Can you try with nightly builds? https://beats-nightlies.s3.amazonaws.com/index.html?prefix=packetbeat/