In Mysql or Http, i'm not getting whole path or query. That query is dividing into different lines. Can you please help me for this.
Hi,
you have to use "raw" value of query field. As for logstash packetbeat provides two "versions" of the field value, the raw version is interpreted literally, and not divided by backspaces or dots or whatever.
So use query.raw as fileld for your visualization.
Actually the latest packetbeat version doesn't follow the logstash convention of providing the fields twice. This is because in Packetbeat we know quite well what each field is, so we can choose to analyze them or not depending on the field. Most fields, including the query, are set to not analyzed in the default template.
@Akhilesh_Anb, you might have missed loading the template. See this line from the getting started guide:
curl -XPUT 'http://localhost:9200/_template/packetbeat' -d@/etc/packetbeat/packetbeat.template.jsonNo Tudor, I have done this step also. For the first time i got whole query. I think after updated to Beta im not getting whole query.
I apologize for my misunderstanding and for my statement.
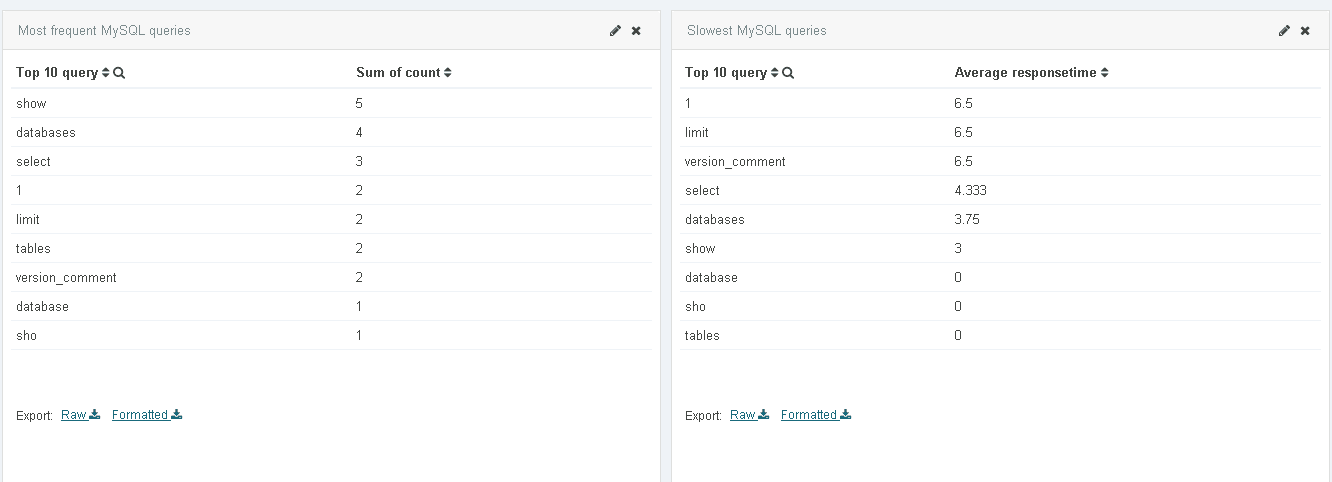
I thought that it was so because I selected, in the list of fields in a mysql visualization on Kibana, query.raw field and I got the correct result for example I got "select * from Persons" instead of separated words as Akilesh_Anb showed.
You can then check the resulting mapping in Elasticsearch with something like this:
'http://<elasticsearch-url>/packetbeat-2015.07.01/_mapping?pretty'
The query field should have index: not_analyzed. Note that the template has changes significantly in the beta1 release.
I ran into the EXACT same issue listed here and I was able to successfully fix the issue.
Root Cause: I didn't load in the Packetbeat default template FIRST BEFORE sending Packetbeat agent data to Elasticsearch. Oops...
The Fix: Create the Packetbeat default index template in the ES instance, delete ALL Packetbeat indexes from the ES instance, reload the index pattern in Kibana.
Details:
Yet again, I jumped into using the Elastic Stack before fully documenting my implementation plan and fully reading the instructions. Note the official docs about the Packetbeat index template here: https://www.elastic.co/guide/en/beats/packetbeat/current/packetbeat-template.html.
"Before starting Packetbeat, you need to load the index template, which lets Elasticsearch know which fields should be analyzed in which way."
Loading the index template should be done BEFORE loading in ANY Packetbeat data to Elasticsearch! If you don't load the template first, like me, then you have no choice to purge packetbeat indexes from ES and start over from scratch.
First thing you need to do is load the index template. I did this using the Sense add-on in Google Chrome. Then you'll have to purge all Packetbeat indexes from the Elasticsearch instance. Finally, once new Packetbeat indexes are created open up Kibana then reload the index patterns for the Packetbeat index.
I hope this helps others that ran into the same issue I had.