Team,
We have a ansible setup in our environment and even are using a Kibana Dashboard for resporting purpose. We are getting below attached error while pushing the reports from ansible logs to kibana dashboard.
{
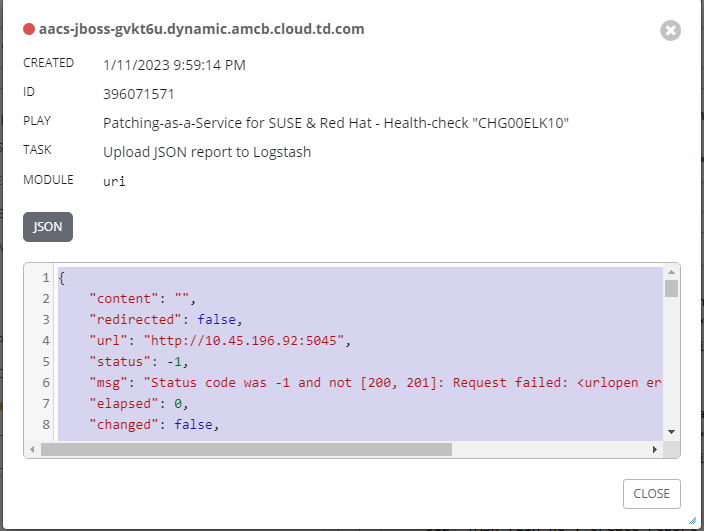
"content": "",

"redirected": false,

"url": http://10.45.196.92:5045,

"status": -1,

"msg": "Status code was -1 and not [200, 201]: Request failed: <urlopen error [Errno 111] Connection refused>",

"elapsed": 0,

"changed": false,

"invocation": {

    "module_args": {

        "url": http://10.45.196.92:5045,

        "method": "POST",

        "body": {

            "hostname": "aacs-jboss-gvkt6u.dynamic.amcb.cloud.td.com",

            "report_type": "health-check",

            "snow_change_id": "CHG00ELK10",

            "epoch": 1673454445,

            "node_type": "standalone",

            "salt_status": "integrated",

            "uptime_status": true,

            "disk_status": true,

            "system_disk_status": true,

            "disk_io_status": true,

            "memory_status": true,

            "swap_status": true,

            "cpu_status": true,

            "subscription_status": true,

            "repository_dry_run_status": true,

            "service_status": true,

            "package_cache_status": true,

            "boot_partition_status": true,

            "mount_status": true,

            "zombie_status": true,

            "log_status": true,

            "mtu_status": true,

            "ping_status": true,

            "ntp_status": true,

            "status": true

        },

        "body_format": "json",

        "status_code": [

            200,

            201

        ],

        "force": false,

        "http_agent": "ansible-httpget",

        "use_proxy": true,

        "validate_certs": true,

        "force_basic_auth": false,

        "return_content": false,

        "follow_redirects": "safe",

        "timeout": 30,

        "headers": {

            "Content-Type": "application/json"

        },

        "follow": false,

        "url_username": null,

        "url_password": null,

        "client_cert": null,

        "client_key": null,

        "dest": null,

        "src": null,

        "creates": null,

        "removes": null,

        "unix_socket": null,

        "mode": null,

        "owner": null,

        "group": null,

        "seuser": null,

        "serole": null,

        "selevel": null,

        "setype": null,

        "attributes": null,

        "content": null,

        "backup": null,

        "remote_src": null,

        "regexp": null,

        "delimiter": null,

        "directory_mode": null,

        "unsafe_writes": null

    }

},

"_ansible_no_log": false,

"_ansible_delegated_vars": {}
}