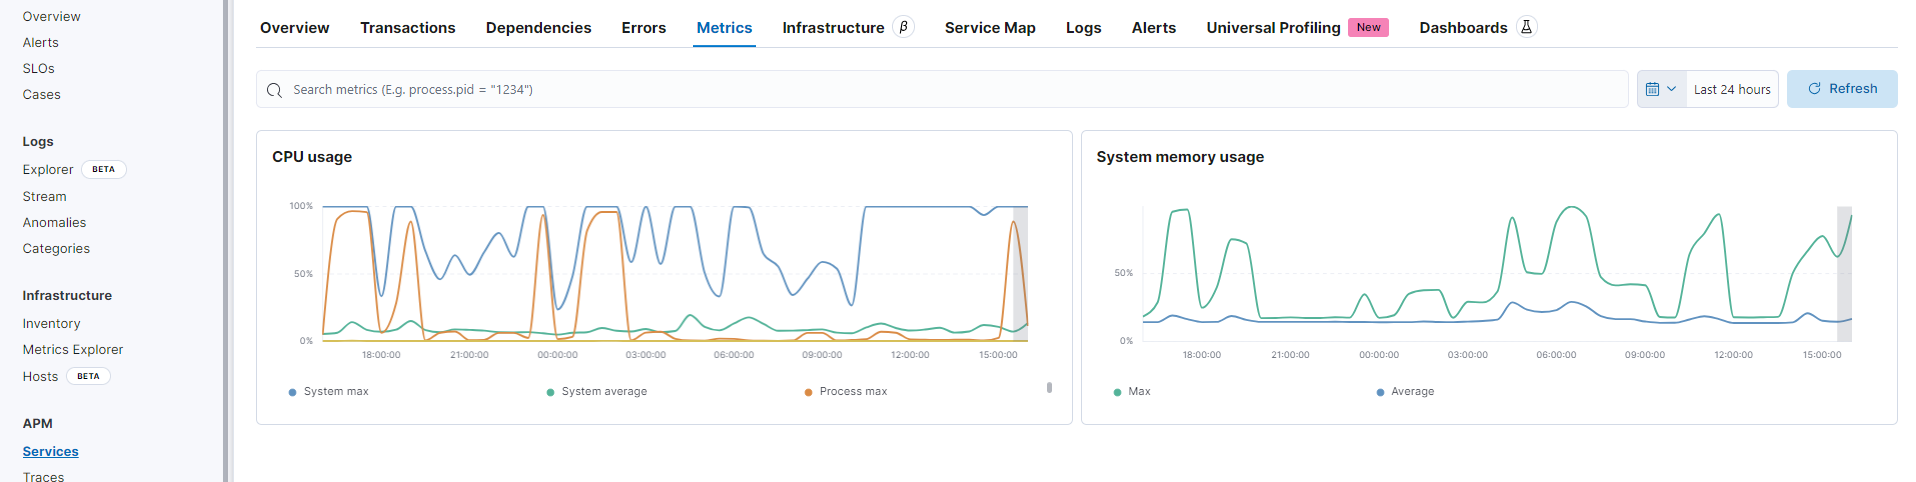
I am unable to figure out the data provided by below graph.
Is it the memory/CPU consumption by single server or average of all servers under which service has been running?
Is it at Process level , if yes which process and which server?
These are aggregated system metrics across all systems only filtered by the service name. You can use the query bar to filter down by instance using service.node.name or navigating there via the Overview tab and clicking on an instance.
© 2020. All Rights Reserved - Elasticsearch
Apache, Apache Lucene, Apache Hadoop, Hadoop, HDFS and the yellow elephant logo are trademarks of the Apache Software Foundation in the United States and/or other countries.