stevedearl
December 14, 2021, 11:07am
1
Hi All,
After upgrading to from 7.15.2 to 7.16.1 yesterday I've noticed that when I try to view the contents of any cell within a 'discovery' view on a dashboard it now results in a blank page being displayed, rather than the full detailed content of the cell being shown in a smaller pop-out window.
The correct behaviour still works when viewing the Discovery directly (i.e. not embedded within a dashboard) but from the Dashboard it seems to have stopped working.
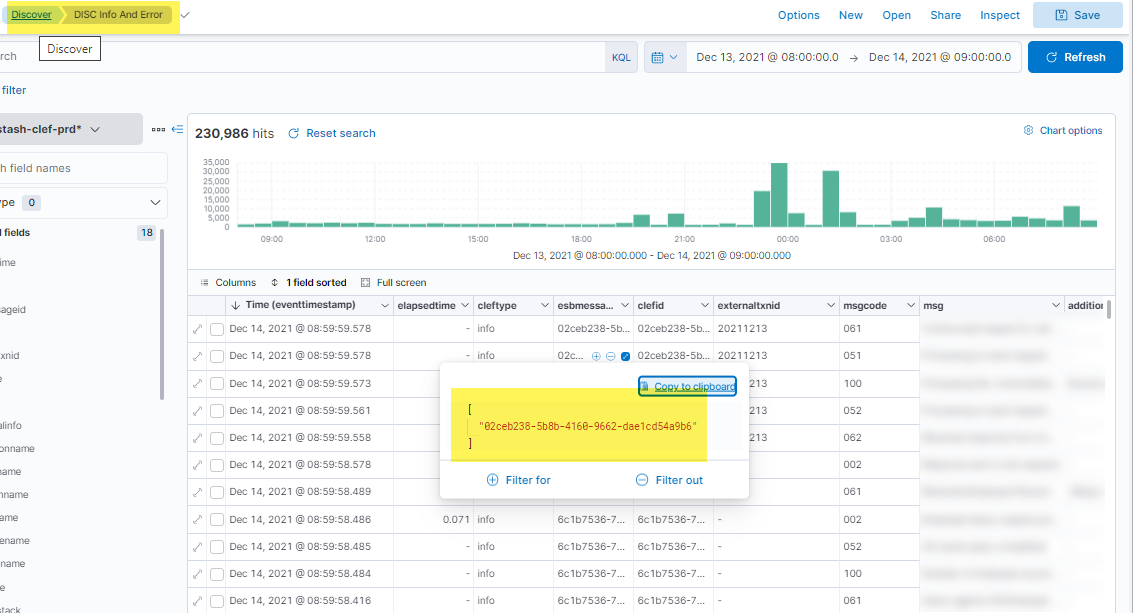
Instead of this in the 'Discovery' view:
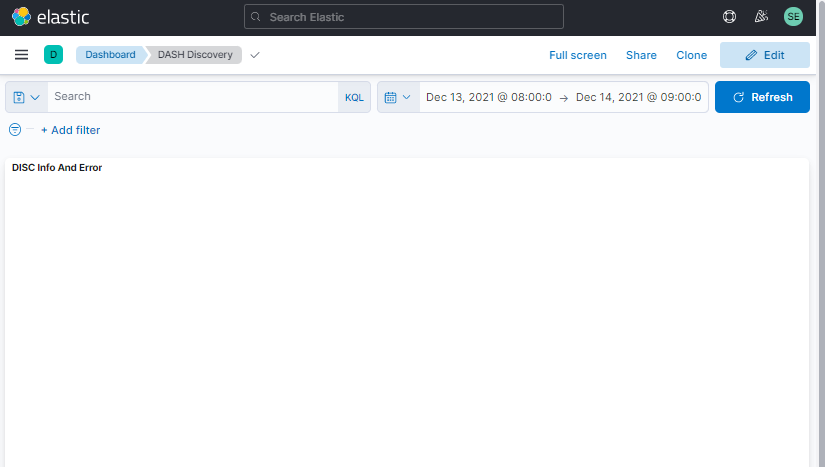
I just see this when trying the same from within a Dashboard:
dosant
December 14, 2021, 1:52pm
2
This looks like a bug,
stevedearl
December 14, 2021, 2:26pm
3
Thanks for the response Anton,
I've raised the issue as you suggested:
opened 02:19PM - 14 Dec 21 UTC
bug
needs-team
**Kibana version:**
7.16.1
**Elasticsearch version:**
7.16.1
**Server OS ver… sion:**
Windows Server 2016
**Browser version:**
Chrome 95.0.4638.69
**Browser OS version:**
95.0.4638.69
**Original install method (e.g. download page, yum, from source, etc.):**
Download page, unzip Windows zip files.
**Describe the bug:**
After upgrading to from 7.15.2 to 7.16.1 yesterday I've noticed that when I try to view the contents of any cell within a 'discovery' view when embedded on a dashboard it now results in a blank page being displayed, rather than the full detailed content of the cell being shown in a smaller pop-out window.
The correct behaviour still works when viewing the Discovery directly (i.e. not embedded within a dashboard) but from the Dashboard it seems to have stopped working.
**Steps to reproduce:**
1. Embed 'Discovery/Search' panel into a dashboard, seeded with sample data
2. Try to view/interact with a cell content within the panel (for example, to be able to view the entire content of a cell)
**Expected behavior:**
Expect to see a small pop-out dialog box containing the whole text content of the cell. Instead I just see a blank page (completely lose the view of the 'Discover' panel data. Hitting 'Refresh' by the datepicker refreshes the Discover panel and shows the rows again.
**Screenshots (if relevant):**
I've attached two screenshots:
What I expect to see (this is from the 'Discovery' page itself, so not embedded within the Dashboard):
What I actually see (this is after clicking on the same cell within the Discovery panel as above, but when it is embedded within a dashboard):
**Errors in browser console (if relevant):**
No errors in console.
**Provide logs and/or server output (if relevant):**
No errors generated in Kibana or Elasticsearch logs.
**Any additional context:**
Thanks,

