Kibana version:
7.10.2
Elasticsearch version:
7.10.2
APM Server version:
1.17.0
APM Agent language and version:
Java
Browser version:
Chrome 79.0.3945.117
Original install method (e.g. download page, yum, deb, from source, etc.) and version:
download page and local setup
Fresh install or upgraded from other version?
No
**
Hello,
I have own, custom code that handle Webservice calls. This code use HttpUrlConnection to call and received information. I need to create own plugin which will catch exception and store some custom data in Error Context. I don't want to store this information on Span or Transaction.
I would like to set information like on screen:

My POC code:
public class PayloadGeneratorInstrumentationAdvice {
    public static final String EXTERNAL_TYPE = "http";
    public static final String HTTP_SUBTYPE = "ws";
    public static final String ACTION = "payload-catch";

    public static final Logger LOG = LoggerFactory.getLogger(PayloadGeneratorInstrumentationAdvice.class);

    @Nullable
    @VisibleForAdvice
    public static ElasticApmTracer tracer;

    public static void init(ElasticApmTracer tracer) {
        PayloadGeneratorInstrumentationAdvice.tracer = tracer;
    }

    @Advice.OnMethodEnter(suppress = Throwable.class)
    public static void onBeforeExecute(@Advice.This PayloadGenerator payloadGenerator,
                                       @Advice.Argument(value = 0) long timeout,
                                       @Advice.Argument(value = 1) TimeUnit unit,
                                       @Advice.Local("span") @Nullable Span span) {
        if (tracer == null || tracer.getActive() == null) {
            LOG.debug("Tracer is null do nothing");
            return;
        }
        final AbstractSpan<?> parent = tracer.getActive();

        LOG.error("parent is = "+parent.getNameAsString());


        span = parent.createExitSpan();
        if (span != null) {
            span.withType(EXTERNAL_TYPE)
                .withSubtype(HTTP_SUBTYPE)
                .withAction(ACTION)
                .appendToName("GenerateAndSendWebserviceCall");
            span.activate();
        }
    }

    @Advice.OnMethodExit(suppress = Throwable.class, onThrowable = Throwable.class)
    public static void onAfterExecute(@Advice.This PayloadGenerator PayloadGenerator,
                                      @Advice.Return @Nullable Object returnValue,
                                      @Advice.Local("span") @Nullable Span span,
                                      @Advice.Thrown @Nullable Throwable t) {
        if (tracer == null || tracer.getActive() == null) {
            LOG.debug("Tracer is null do nothing");
            return;
        }
        try {
            if(span != null && t!= null) {
                ErrorCapture errorCapture = tracer.captureException(t, span , null);
                errorCapture.activate();
                errorCapture.getContext().getRequest().setRawBody("moje setRawBody");
                errorCapture.getContext().getRequest().addHeader("moj-example", "on header");
                errorCapture.getContext().getRequest().withMethod("POST");
                errorCapture.getContext().getMessage().appendToBody("appendToBody on message");
                errorCapture.getContext().addLabel("http.payload2", "my addLabel");
                errorCapture.getContext().addCustom("http.payload-custom2", "my addCustom");

                span.getContext().addLabel("myOnSPan","moj na spanie");
                LOG.debug("Span name= "+span.getNameAsString() + "My new Creating Error with ID = "+errorCapture.getTraceContext().getId() + " getTransactionId = " +errorCapture.getTraceContext().getTransactionId());
                errorCapture.deactivate().end();
            }
        } finally {
            span.deactivate().end();
        }
    }
}
In log I see:
ERROR co.elastic.apm.agent.gw.wsc.AsyncResponseImplInstrumentationAdvice - Span name= GenerateAndSendWebserviceCallMy new Creating Error with ID = 9252f52ac388588b2e2f75ec5454dae1 getTransactionId = dc5260d6542883dd
In kibana I can see this transaction
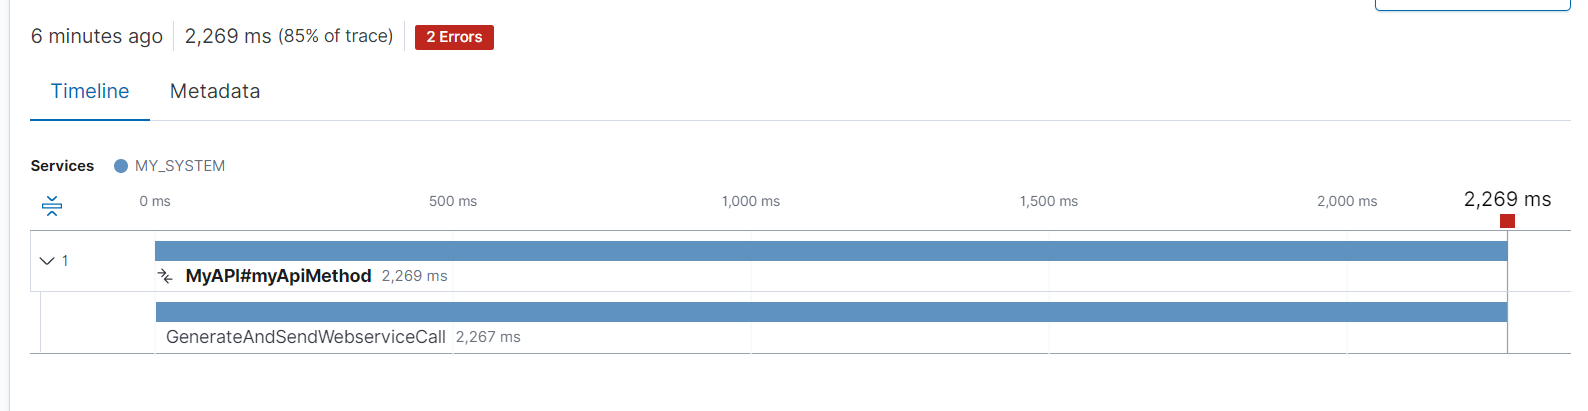
On top I get information about 2 errors, but on timeline I see only 1 error
Full stack look like:

Full view show 3 errors.
- Post#FromGUI - transaction start when user hit button
- MyApi#MyApiMethod - other custom plugin "MyTransactionHelper" that catch API service name and method. Create child transaction.
- GenerateAndSendWebserviceCall - my plugin
On this view there is no info about my error. When I click to error I get information about other error (I think error from "Post#FromGUI")
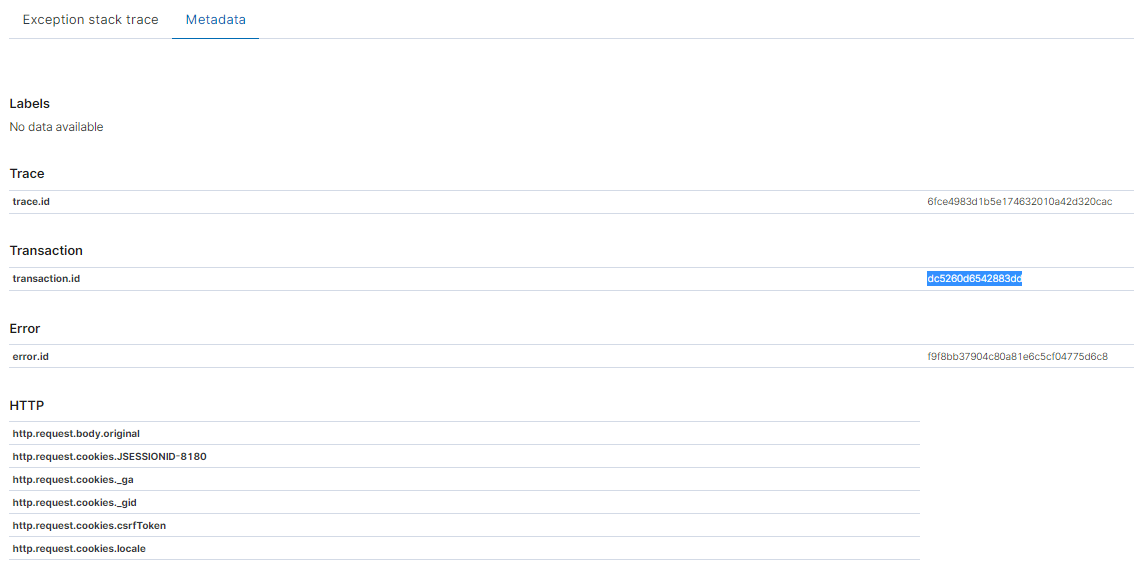
From LOG I get my error ID and search in Kibana. Search by "error.id : 9252f52ac388588b2e2f75ec5454dae1" show:

It look like my error was registered not on my SPAN, but on main transaction (POST#FromGUI) and then override by other captureException.
From debug I know that span when I call captureException is "GenerateAndSendWebserviceCall"
ErrorCapture errorCapture = tracer.captureException(t, span , null);
Full log is very long and include sensitive data. I Include part of logs that can be helpfull.
DEBUG co.elastic.apm.agent.my.MyTransactionHelper - Transaction started
DEBUG co.elastic.apm.agent.impl.transaction.AbstractSpan - increment references to '' 00-6fce4983d1b5e174632010a42d320cac-fb2183e4bd728235-01 (7008d536) (1)
DEBUG co.elastic.apm.agent.impl.ElasticApmTracer - startTransaction '' 00-6fce4983d1b5e174632010a42d320cac-fb2183e4bd728235-01 (7008d536) {
DEBUG co.elastic.apm.agent.impl.ElasticApmTracer - Activating '' 00-6fce4983d1b5e174632010a42d320cac-fb2183e4bd728235-01 (7008d536) on thread 31020
DEBUG co.elastic.apm.agent.impl.transaction.AbstractSpan - increment references to '' 00-6fce4983d1b5e174632010a42d320cac-fb2183e4bd728235-01 (7008d536) (2)
DEBUG co.elastic.apm.agent.my.MyTransactionHelper - Set name  to transaction fb2183e4bd728235
DEBUG co.elastic.apm.agent.my.MyTransactionHelper - Transaction fb2183e4bd728235 with name MyAPI#MyApiMethod
DEBUG co.elastic.apm.agent.my.MyTransactionHelper - Transaction fb2183e4bd728235 with type my-ws-consumer
DEBUG co.elastic.apm.agent.impl.transaction.Span - startSpan '' 00-6fce4983d1b5e174632010a42d320cac-a900ba119ac5cf0c-01 (5b55dd78) {
DEBUG co.elastic.apm.agent.impl.transaction.AbstractSpan - increment references to 'MyAPI#MyApiMethod ' 00-6fce4983d1b5e174632010a42d320cac-fb2183e4bd728235-01 (7008d536) (3)
DEBUG co.elastic.apm.agent.impl.transaction.AbstractSpan - increment references to '' 00-6fce4983d1b5e174632010a42d320cac-a900ba119ac5cf0c-01 (5b55dd78) (1)
DEBUG co.elastic.apm.agent.impl.transaction.AbstractSpan - increment references to 'MyAPI#MyApiMethod ' 00-6fce4983d1b5e174632010a42d320cac-fb2183e4bd728235-01 (7008d536) (4)
DEBUG co.elastic.apm.agent.impl.ElasticApmTracer - Activating 'GenerateAndSendWebserviceCall' 00-6fce4983d1b5e174632010a42d320cac-a900ba119ac5cf0c-01 (5b55dd78) on thread 31020
DEBUG co.elastic.apm.agent.impl.transaction.AbstractSpan - increment references to 'MyAPI#MyApiMethod ' 00-6fce4983d1b5e174632010a42d320cac-fb2183e4bd728235-01 (7008d536) (5)
DEBUG co.elastic.apm.agent.impl.transaction.AbstractSpan - increment references to 'GenerateAndSendWebserviceCall' 00-6fce4983d1b5e174632010a42d320cac-a900ba119ac5cf0c-01 (5b55dd78) (2)
DEBUG co.elastic.apm.agent.my.wsc.PayloadGeneratorInstrumentationAdvice  - Span name= GenerateAndSendWebserviceCallMy new Creating Error with ID = 9252f52ac388588b2e2f75ec5454dae1 getTransactionId = dc5260d6542883dd
DEBUG co.elastic.apm.agent.impl.ElasticApmTracer - Deactivating 'GenerateAndSendWebserviceCall' 00-6fce4983d1b5e174632010a42d320cac-a900ba119ac5cf0c-01 (5b55dd78) on thread 31020
DEBUG co.elastic.apm.agent.impl.transaction.AbstractSpan - decrement references to 'MyAPI#MyApiMethod ' 00-6fce4983d1b5e174632010a42d320cac-fb2183e4bd728235-01 (7008d536) (4)
DEBUG co.elastic.apm.agent.impl.transaction.AbstractSpan - decrement references to 'GenerateAndSendWebserviceCall' 00-6fce4983d1b5e174632010a42d320cac-a900ba119ac5cf0c-01 (5b55dd78) (1)
DEBUG co.elastic.apm.agent.impl.transaction.Span - endSpan 'GenerateAndSendWebserviceCall' 00-6fce4983d1b5e174632010a42d320cac-a900ba119ac5cf0c-01 (5b55dd78)
DEBUG co.elastic.apm.agent.impl.transaction.AbstractSpan - decrement references to 'MyAPI#MyApiMethod ' 00-6fce4983d1b5e174632010a42d320cac-fb2183e4bd728235-01 (7008d536) (3)
DEBUG co.elastic.apm.agent.my.MyTransactionHelper - Capture exception
my.xml.ws.WsdlFault: java.lang.IllegalThreadStateException: Moj blad!
Thank for any help.


