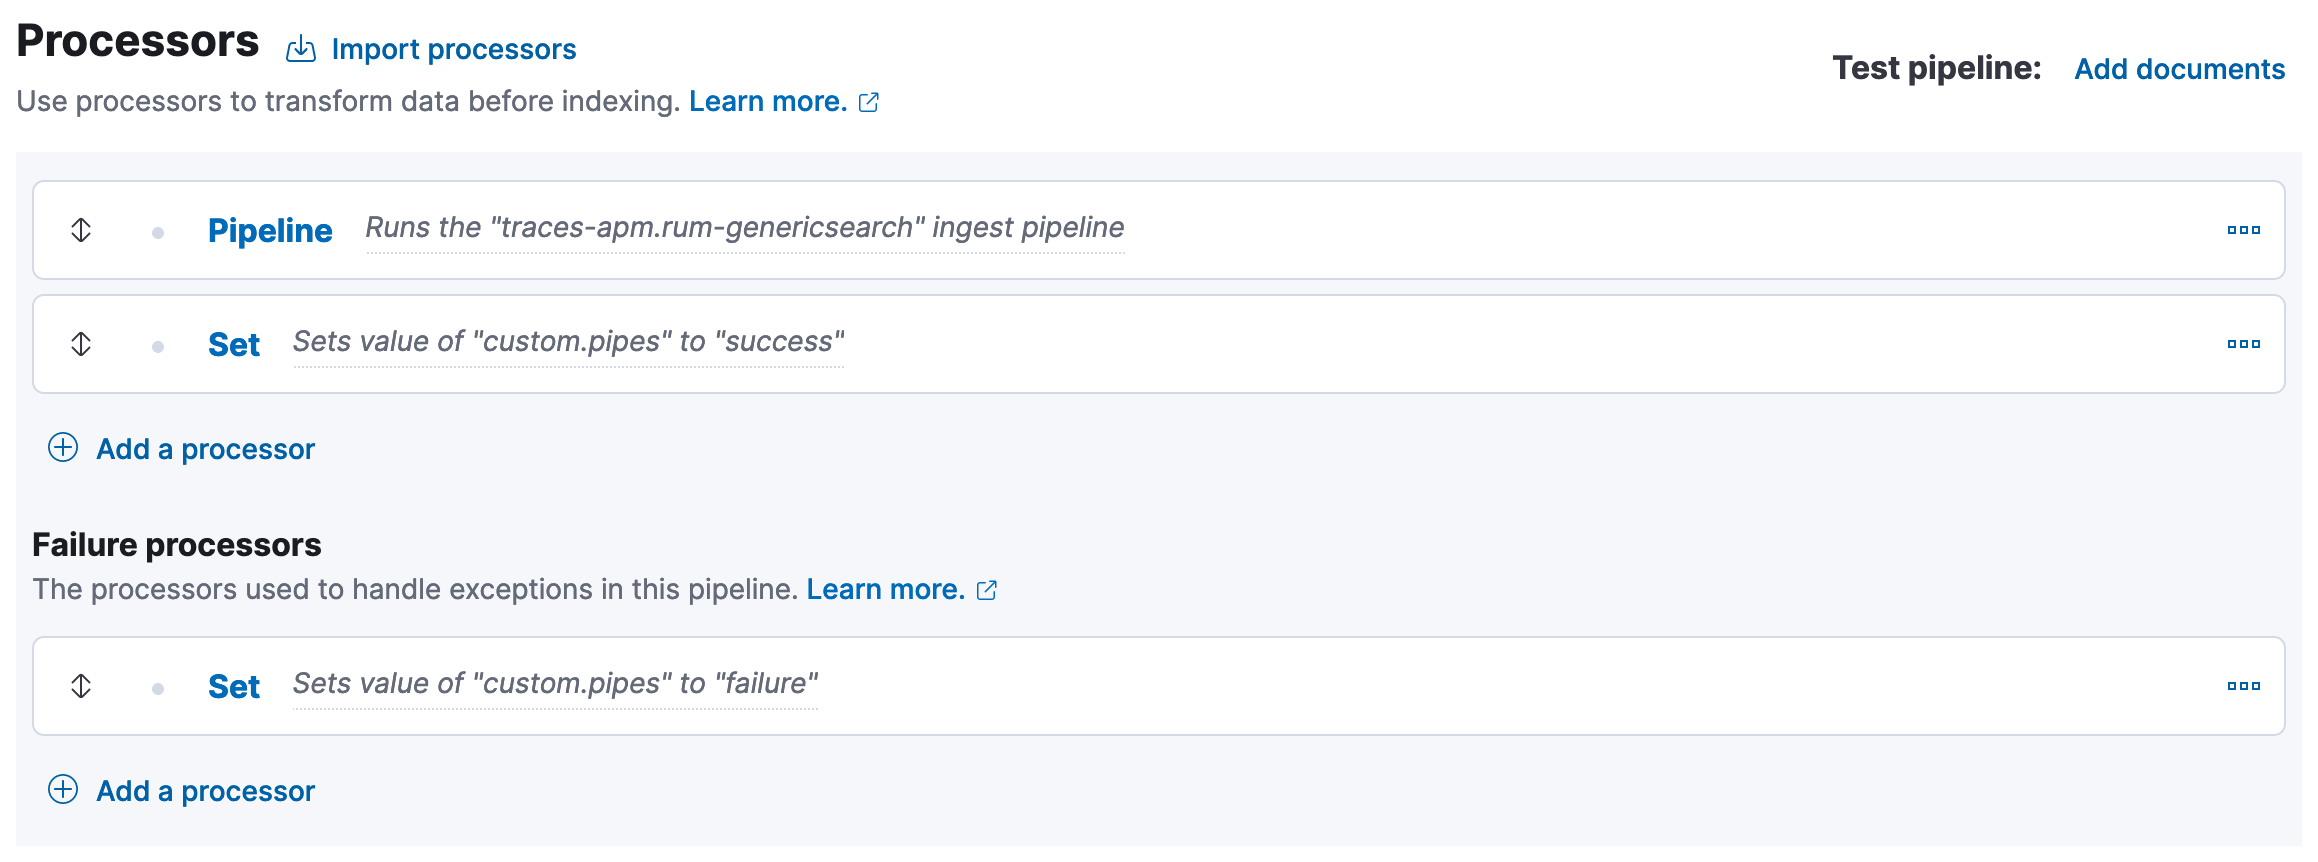
RUM traces work fine in the UI until I create a traces-apm.rum@custom pipeline with a pipeline processor. The presence of the pipeline processor breaks RUM transaction traces creating a perpetual loading animation in the UI under trace sample in Kibana.
After extensive testing I can resolve this by adding a arbitrary set processor after the pipeline processor and also a arbitrary set processor in the failure processors. I can't understand why this is necessary, the pipeline processor does not fail and the conditional on the pipeline processor is working correctly.
The presence of the pipeline processor breaks RUM transaction traces creating a perpetual loading animation in the UI under trace sample in Kibana.
This sounds strange, and not something I've observed before. Can you share your traces-apm.rum-genericsearch pipeline? Can you see an errors in the browser console when the UI goes into this perpetual loading state?
I think after a little more testing the loading state occurred because there was simply no trace sample for the transaction. I can't reproduce the loading trace as I have some trace samples now but if you set the time span to for example 1 second with no transactions it produces the same effect. This screenshot shows the disparity between total transactions and trace samples with a sample rate of 1.
Also, just to confirm that the data was definitely going to the cluster I checked the browser post requests and all the trace data was there and the request successful.
I guess you verified that by checking if any docs had custom.pipes: failure? It sounds like the ingest pipeline is failing, since if there's no processors defined there then it'll just throw an exception.
If you remove the set processors, but configure ignore_failure: true on the pipeline processor, does that allow trace events to be ingested?
Are there any errors reported in the APM Server log?
I think after a little more testing the loading state occurred because there was simply no trace sample for the transaction. I can't reproduce the loading trace as I have some trace samples now but if you set the time span to for example 1 second with no transactions it produces the same effect. This screenshot shows the disparity between total transactions and trace samples with a sample rate of 1.
The latency distribution is based off pre-aggregated metrics (calculated by APM Server), so if individual trace events are being dropped due to a failing ingest pipeline then that may explain the disparity.
I just tested with ignore_failure: true and still the same result. This time actually I don't get the trace but something does appear in the trace sample. See:
Apache, Apache Lucene, Apache Hadoop, Hadoop, HDFS and the yellow elephant
logo are trademarks of the
Apache Software Foundation
in the United States and/or other countries.