Addressing Filebeat's memory leak and performance issues with high log volume

Hello,

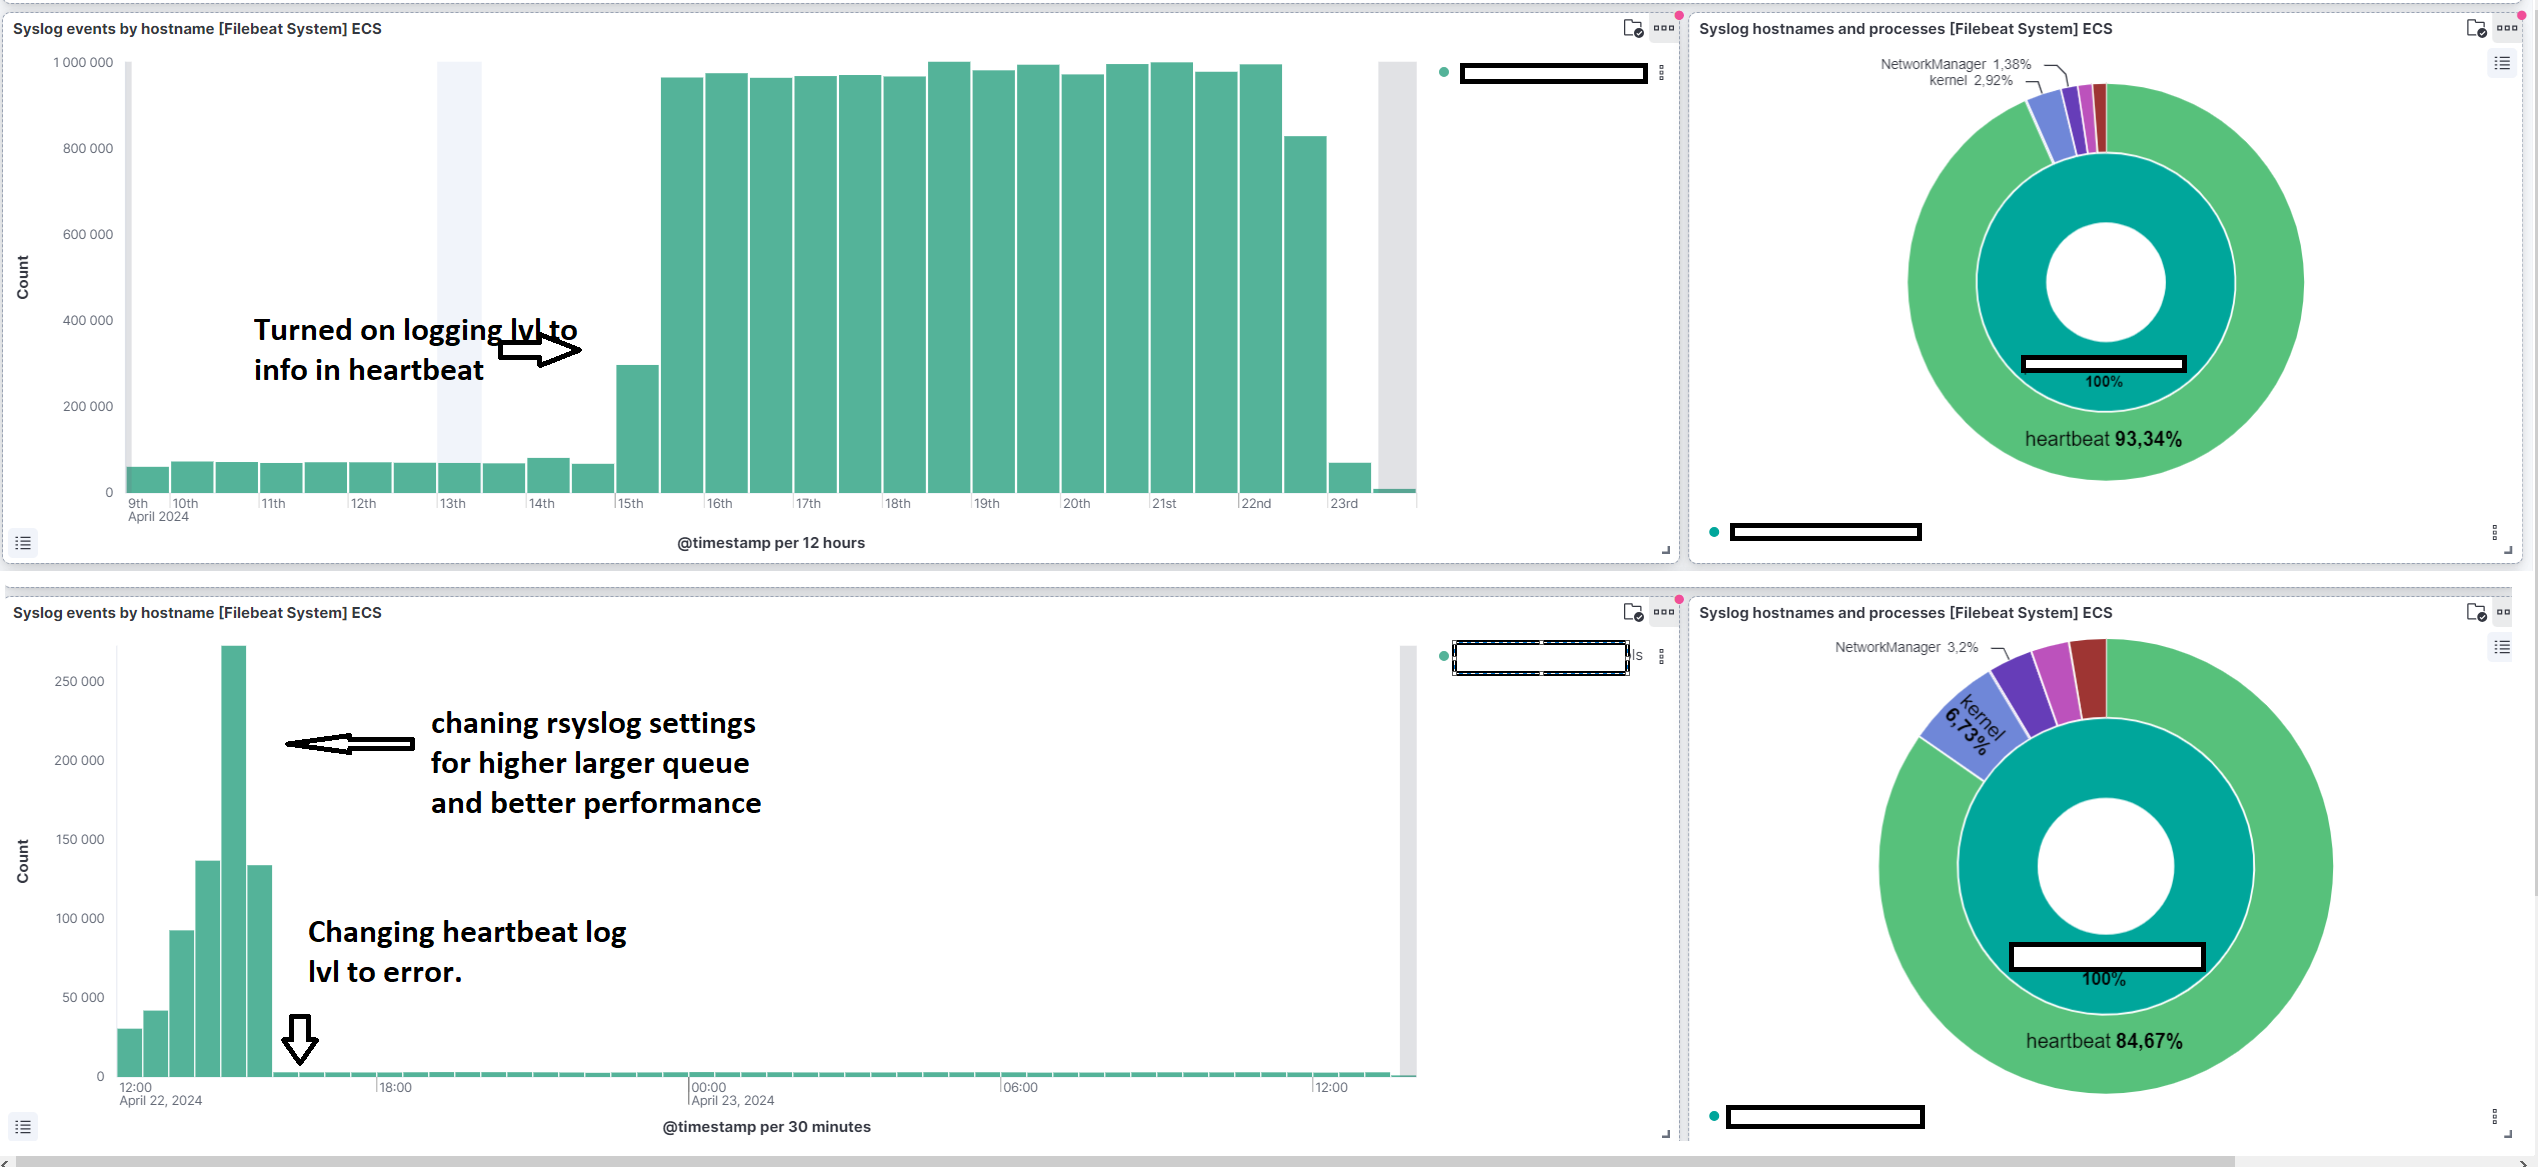
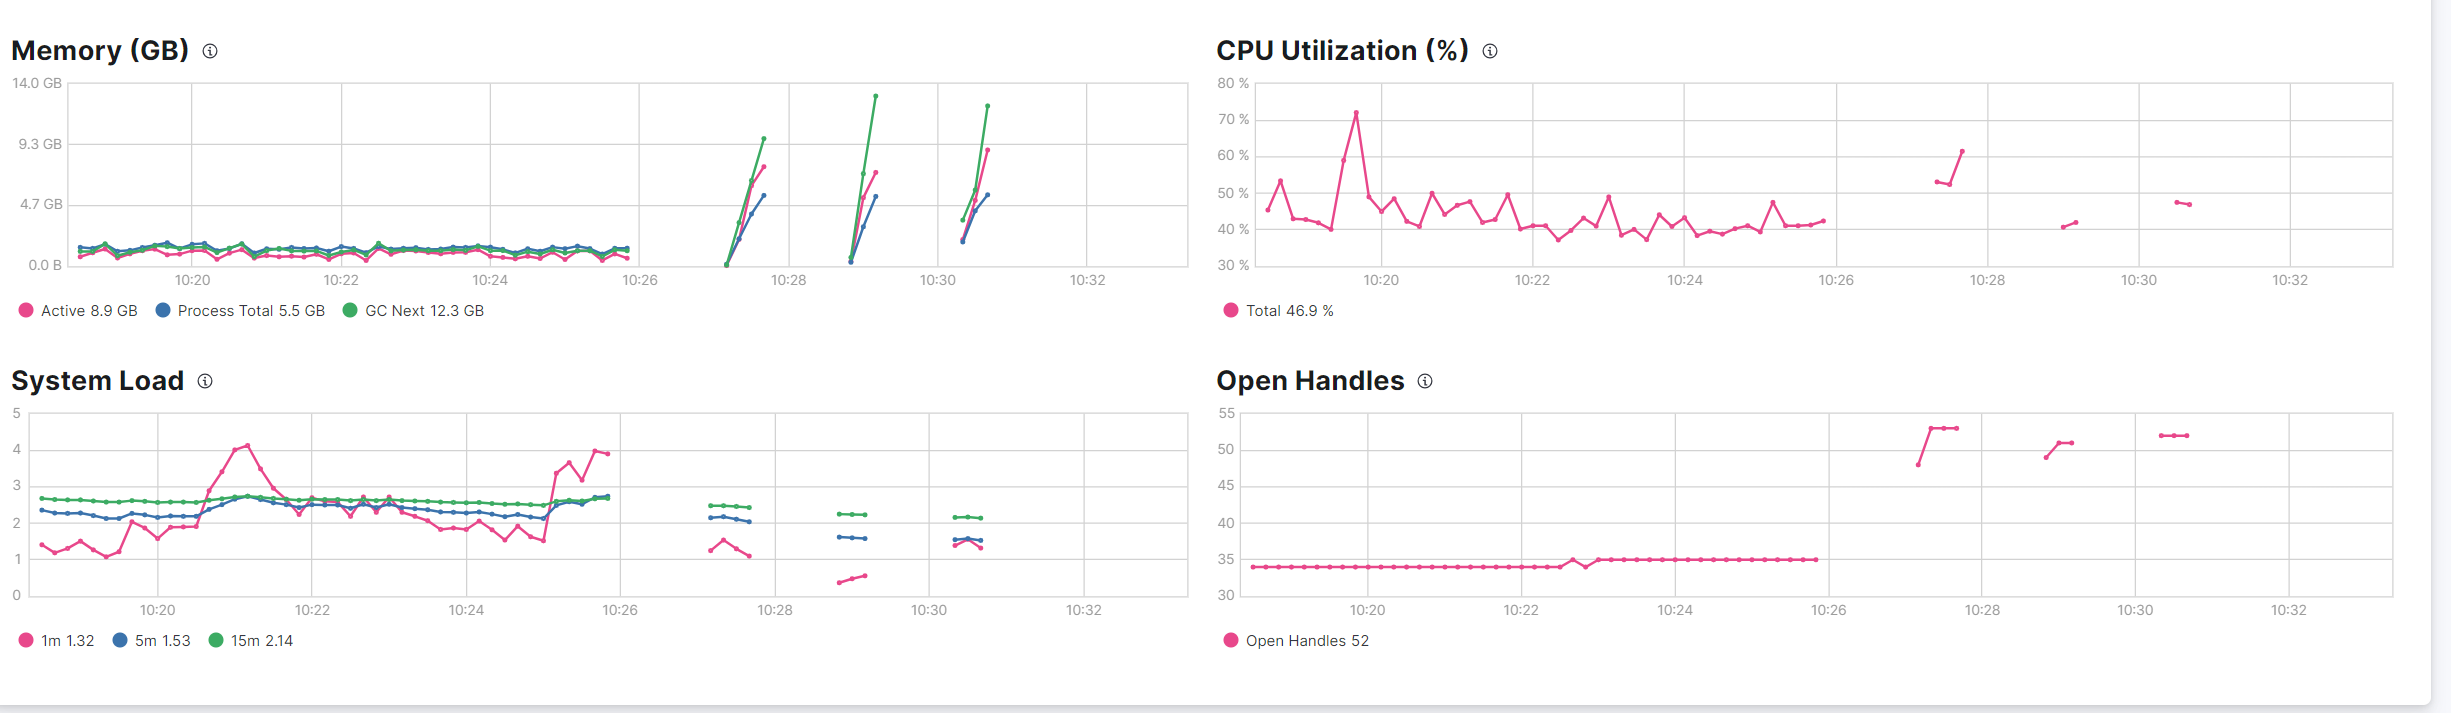
Recently, we've encountered significant challenges with Filebeat's memory usage and performance, specifically after integrating additional netflow shippers. This led to Filebeat running out of memory just minutes after startup, with a hard cap of 6 GB set in the service configuration. Adjustments like reducing the harvester_limit from 100 to 20 provided temporary relief. However, the issue persists, pointing towards possible performance issues with syslog file reading in the Fortinet or Cisco modules. Disabling the Fortinet module has momentarily resolved the issue.

Generally, I think it is related to Elevated Memory Utilization and Errors in Filebeat When Integrating External MISP CTI Log Source ยท Issue #38053 ยท elastic/beats ยท GitHub

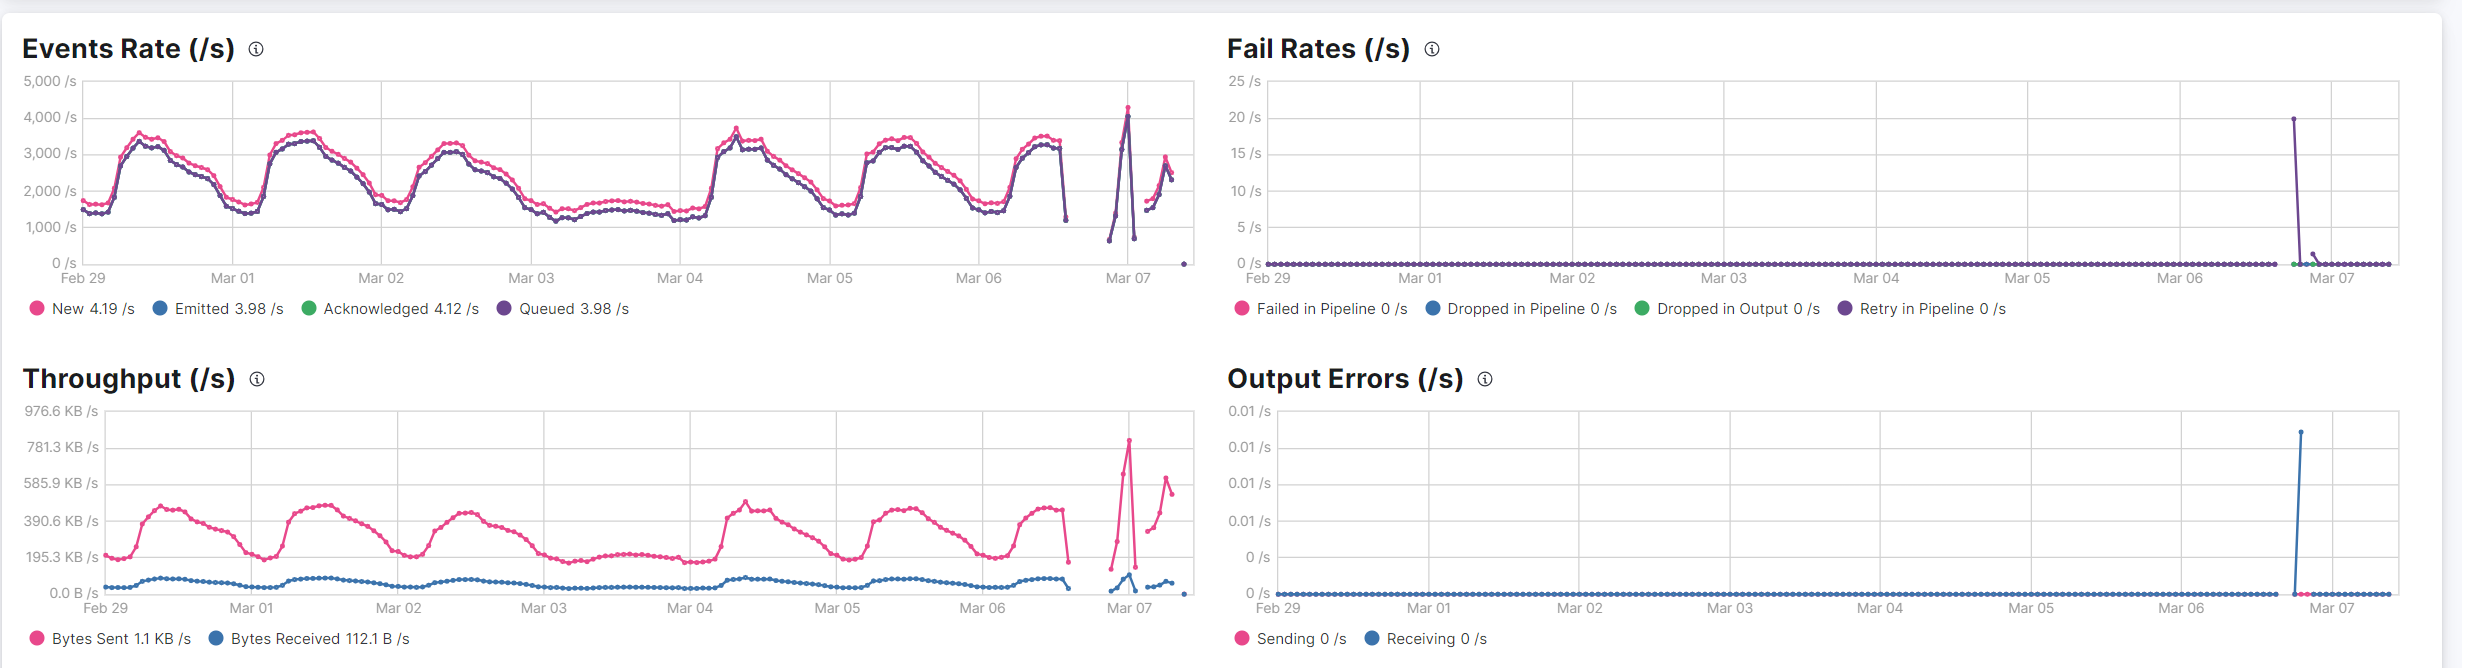
When Filebeat, specifically with the Fortinet module enabled, processes a high volume of logs, there is a noticeable and rapid increase in memory usage. This phenomenon is accompanied by log entries indicating the establishment of a connection to Elasticsearch, suggesting that the performance bottleneck may be related to the handling of output connections in environments with heavy log traffic.

log.logger":"publisher_pipeline_output","log.origin":{"file.name":"pipeline/client_worker.go","file.line":145},"message":"Connec
tion to backoff(elasticsearch(https://someurl:9200)) established","service.name":"filebeat","ecs.version":"1.6.0"}

Can you suggest a resolution via filebeat configuration for quicker handling of documents?

CONTEX:
OS:EuroLinux 8.9 (Monaco)
Filebeat: 8.11.3
Elasticserach: 8.11.3
CPU: 2
MEM:12 GB
Modules: Netflow, Fortinet, System, Cisco,

CONFIG:

#=========================== Filebeat inputs =============================
filebeat.inputs:

# Each - is an input. Most options can be set at the input level, so
# you can use different inputs for various configurations.
# Below are the input specific configurations.


- type: log

  scan_frequency: 10s
  harvester_limit: 20
  backoff: 2s
  max_backoff: 10s
  backoff_factor: 2

...
  worker: 20
  flush.interval: 1s

  bulk_max_size: 20480
#  compression_level: 5
  indices:

    - index: "filebeat-%{[agent.version]}-netflow-%{+yyyy.MM.dd}"
      when.equals:
        event.module: "netflow"

    - index: "filebeat-%{[agent.version]}-cisco-%{+xxxx.ww}"
      when.equals:
        event.module: "cisco"

    - index: "filebeat-%{[agent.version]}-system-%{+xxxx.ww}"
      when.equals:
        event.module: "system"

    - index: "filebeat-%{[agent.version]}-elasticsearch-%{+xxxx.ww}"
      when.equals:
        event.module: "elasticsearch"

    - index: "filebeat-%{[agent.version]}-fortinet-%{+yyyy.MM.dd}"
      when.equals:
        event.module: "fortinet"
...


processors:
  - add_host_metadata: ~
#  - add_cloud_metadata: ~
#  - add_docker_metadata: ~
#  - add_kubernetes_metadata: ~
  - add_fields:
      target: ''
      fields:
        observer.name: "GCP"
      when.equals:
        event.dataset: "gcp.firewall"
  - drop_event:
      when.and:
        - equals:
            event.module: "netflow"
        - equals:
            network.transport: "icmp"


...
queue.mem:
  events: 2048
  flush.min_events: 512
  flush.timeout: 1s

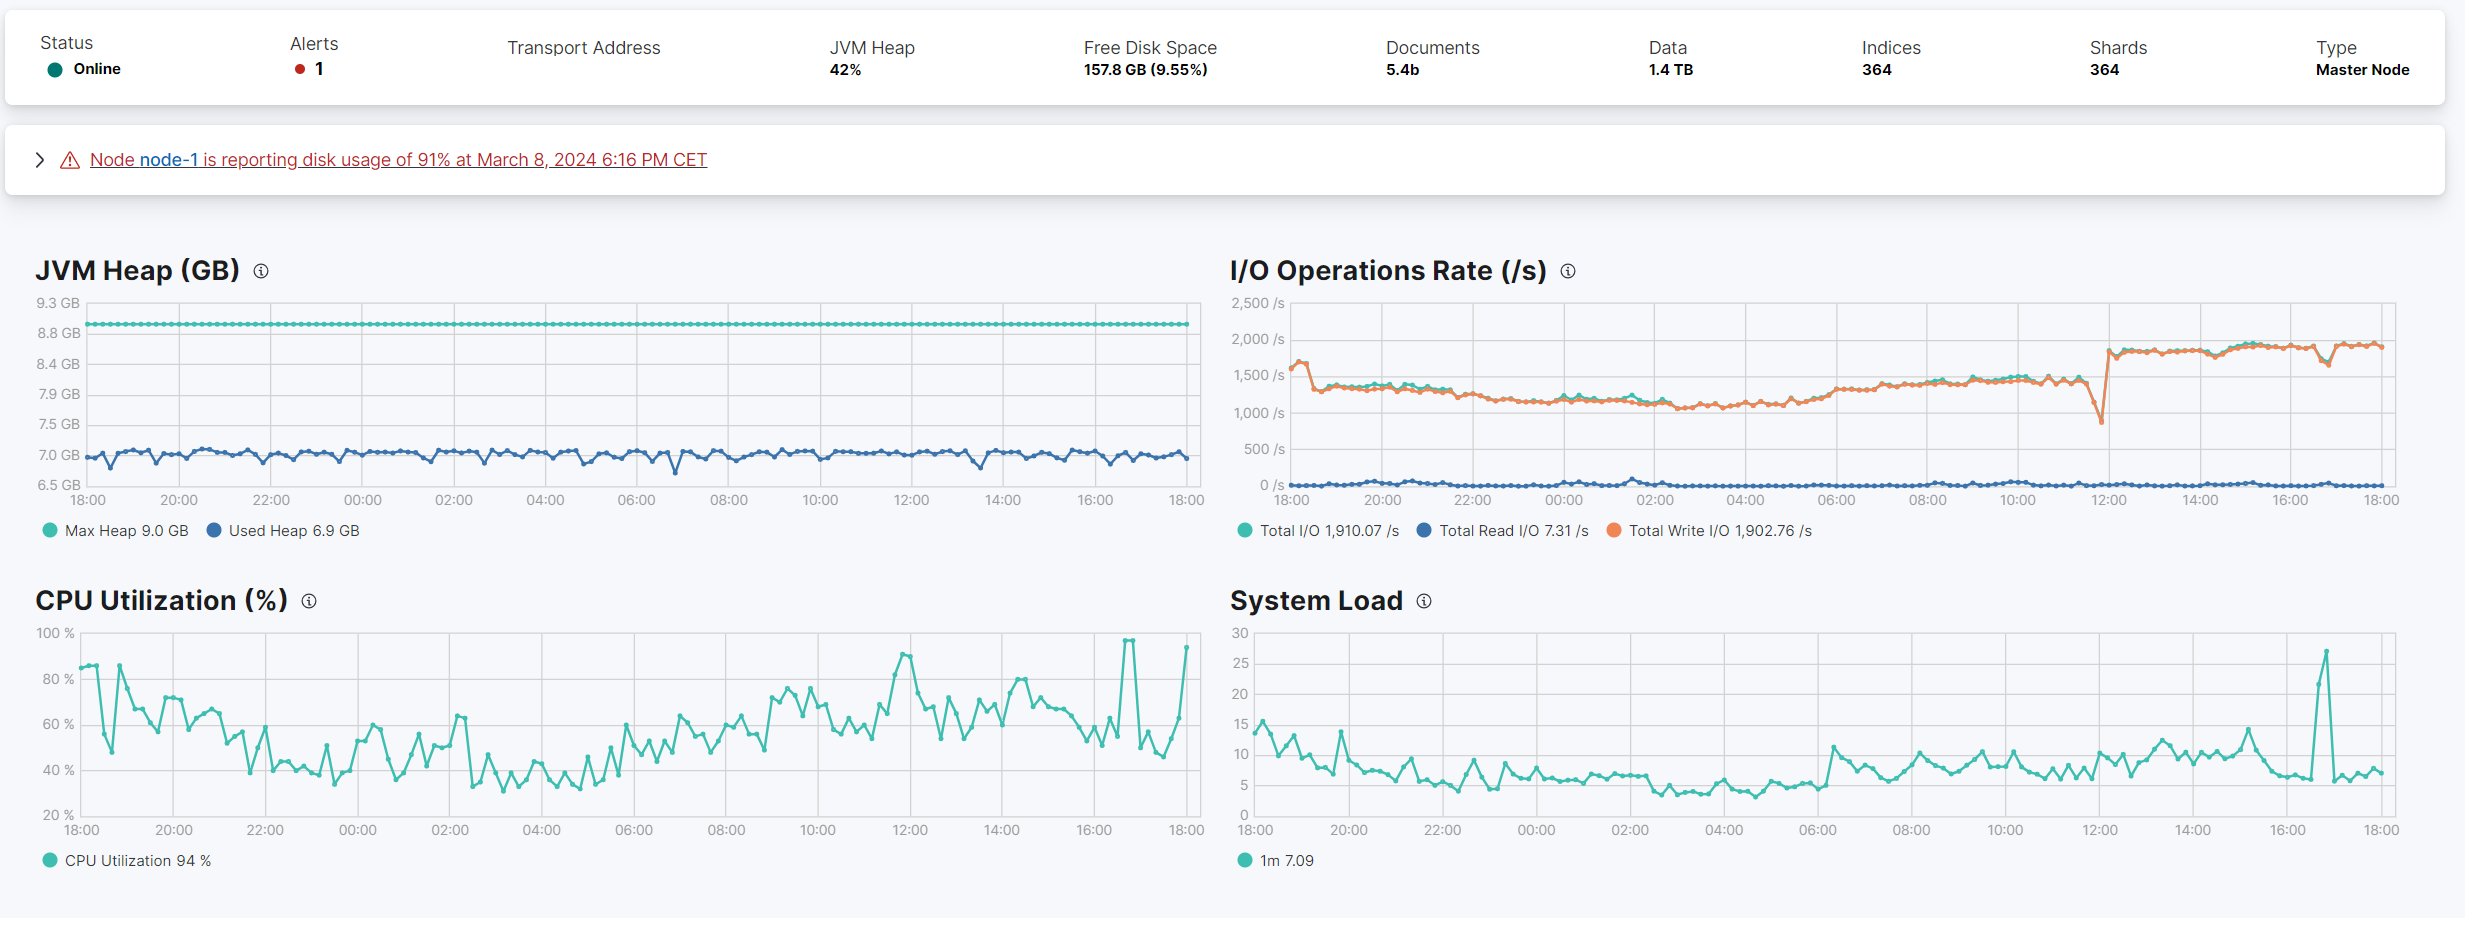
Error on elasticsearch side

[2024-03-07T11:04:03,413][WARN ][o.e.h.AbstractHttpServerTransport] [node-1] caught exception while handling client http traffic, closin                                                                                                               g connection Netty4HttpChannel{localAddress=/10.zzz.3:9200, remoteAddress=/10.xxx21:56212}
io.netty.handler.codec.PrematureChannelClosureException: Channel closed while still aggregating message
        at io.netty.handler.codec.MessageAggregator.channelInactive(MessageAggregator.java:436) ~[?:?]
        at io.netty.channel.AbstractChannelHandlerContext.invokeChannelInactive(AbstractChannelHandlerContext.java:305) ~[?:?]
        at io.netty.channel.AbstractChannelHandlerContext.invokeChannelInactive(AbstractChannelHandlerContext.java:281) ~[?:?]
        at io.netty.channel.AbstractChannelHandlerContext.fireChannelInactive(AbstractChannelHandlerContext.java:274) ~[?:?]
        at io.netty.channel.ChannelInboundHandlerAdapter.channelInactive(ChannelInboundHandlerAdapter.java:81) ~[?:?]
        at io.netty.handler.codec.http.HttpContentDecoder.channelInactive(HttpContentDecoder.java:235) ~[?:?]
        at io.netty.channel.AbstractChannelHandlerContext.invokeChannelInactive(AbstractChannelHandlerContext.java:305) ~[?:?]
        at io.netty.channel.AbstractChannelHandlerContext.invokeChannelInactive(AbstractChannelHandlerContext.java:281) ~[?:?]
        at io.netty.channel.AbstractChannelHandlerContext.fireChannelInactive(AbstractChannelHandlerContext.java:274) ~[?:?]
        at io.netty.channel.ChannelInboundHandlerAdapter.channelInactive(ChannelInboundHandlerAdapter.java:81) ~[?:?]
        at org.elasticsearch.http.netty4.Netty4HttpHeaderValidator.channelInactive(Netty4HttpHeaderValidator.java:186) ~[?:?]
        at io.netty.channel.AbstractChannelHandlerContext.invokeChannelInactive(AbstractChannelHandlerContext.java:305) ~[?:?]
        at io.netty.channel.AbstractChannelHandlerContext.invokeChannelInactive(AbstractChannelHandlerContext.java:281) ~[?:?]
        at io.netty.channel.AbstractChannelHandlerContext.fireChannelInactive(AbstractChannelHandlerContext.java:274) ~[?:?]
        at io.netty.handler.codec.ByteToMessageDecoder.channelInputClosed(ByteToMessageDecoder.java:411) ~[?:?]
        at io.netty.handler.codec.ByteToMessageDecoder.channelInactive(ByteToMessageDecoder.java:376) ~[?:?]
        at io.netty.channel.AbstractChannelHandlerContext.invokeChannelInactive(AbstractChannelHandlerContext.java:305) ~[?:?]
        at io.netty.channel.AbstractChannelHandlerContext.invokeChannelInactive(AbstractChannelHandlerContext.java:281) ~[?:?]
        at io.netty.channel.AbstractChannelHandlerContext.fireChannelInactive(AbstractChannelHandlerContext.java:274) ~[?:?]
        at io.netty.channel.ChannelInboundHandlerAdapter.channelInactive(ChannelInboundHandlerAdapter.java:81) ~[?:?]
        at org.elasticsearch.transport.netty4.Netty4WriteThrottlingHandler.channelInactive(Netty4WriteThrottlingHandler.java:109) ~[?:?]
        at io.netty.channel.AbstractChannelHandlerContext.invokeChannelInactive(AbstractChannelHandlerContext.java:303) ~[?:?]
        at io.netty.channel.AbstractChannelHandlerContext.invokeChannelInactive(AbstractChannelHandlerContext.java:281) ~[?:?]
        at io.netty.channel.AbstractChannelHandlerContext.fireChannelInactive(AbstractChannelHandlerContext.java:274) ~[?:?]
        at io.netty.handler.codec.ByteToMessageDecoder.channelInputClosed(ByteToMessageDecoder.java:411) ~[?:?]
        at io.netty.handler.codec.ByteToMessageDecoder.channelInactive(ByteToMessageDecoder.java:376) ~[?:?]
        at io.netty.handler.ssl.SslHandler.channelInactive(SslHandler.java:1085) ~[?:?]
        at io.netty.channel.AbstractChannelHandlerContext.invokeChannelInactive(AbstractChannelHandlerContext.java:305) ~[?:?]
        at io.netty.channel.AbstractChannelHandlerContext.invokeChannelInactive(AbstractChannelHandlerContext.java:281) ~[?:?]
        at io.netty.channel.AbstractChannelHandlerContext.fireChannelInactive(AbstractChannelHandlerContext.java:274) ~[?:?]
        at io.netty.channel.DefaultChannelPipeline$HeadContext.channelInactive(DefaultChannelPipeline.java:1405) ~[?:?]
        at io.netty.channel.AbstractChannelHandlerContext.invokeChannelInactive(AbstractChannelHandlerContext.java:301) ~[?:?]
        at io.netty.channel.AbstractChannelHandlerContext.invokeChannelInactive(AbstractChannelHandlerContext.java:281) ~[?:?]
        at io.netty.channel.DefaultChannelPipeline.fireChannelInactive(DefaultChannelPipeline.java:901) ~[?:?]
        at io.netty.channel.AbstractChannel$AbstractUnsafe$7.run(AbstractChannel.java:813) ~[?:?]
        at io.netty.util.concurrent.AbstractEventExecutor.runTask(AbstractEventExecutor.java:174) ~[?:?]
        at io.netty.util.concurrent.AbstractEventExecutor.safeExecute(AbstractEventExecutor.java:167) ~[?:?]
        at io.netty.util.concurrent.SingleThreadEventExecutor.runAllTasks(SingleThreadEventExecutor.java:470) ~[?:?]
        at io.netty.channel.nio.NioEventLoop.run(NioEventLoop.java:566) ~[?:?]
        at io.netty.util.concurrent.SingleThreadEventExecutor$4.run(SingleThreadEventExecutor.java:997) ~[?:?]
        at io.netty.util.internal.ThreadExecutorMap$2.run(ThreadExecutorMap.java:74) ~[?:?]
        at java.lang.Thread.run(Thread.java:1583) ~[?:?]

I am starting to think this is some kind of performance issue.

When I run on this beat only Netflow or Fortinet module then everything works correctly. But both at the same time make filebeat to leak memory.

I changed filebeat.input to filestream id and enabled both modules. Still the same behavior.

Every 2.0s: systemctl status filebeat                                                                                                                                                                     HOSTls: Thu Mar  7 15:35:10 2024

โ— filebeat.service - Filebeat sends log files to Logstash or directly to Elasticsearch.
   Loaded: loaded (/usr/lib/systemd/system/filebeat.service; enabled; vendor preset: disabled)
   Active: active (running) since Thu 2024-03-07 15:27:31 CET; 7min ago
     Docs: https://www.elastic.co/beats/filebeat
 Main PID: 322416 (filebeat)
    Tasks: 8 (limit: 74760)
   Memory: 45.9M (max: 6.0G)
   CGroup: /system.slice/filebeat.service
           โ””โ”€322416 /usr/share/filebeat/bin/filebeat --environment systemd -c /etc/filebeat/filebeat.yml --path.home /usr/share/filebeat --path.config /etc/filebeat --path.data /var/lib/filebeat --path.logs /var/log/filebeat

Mar 07 15:27:31 HOSTols systemd[1]: Started Filebeat sends log files to Logstash or directly to Elasticsearch..


โ”€โ”€โ”€โ”€โ”€โ”€โ”€โ”€โ”€โ”€โ”€โ”€โ”€โ”€โ”€โ”€โ”€โ”€โ”€โ”€โ”€โ”€โ”€โ”€โ”€โ”€โ”€โ”€โ”€โ”€โ”€โ”€โ”€โ”€โ”€โ”€โ”€โ”€โ”€โ”€โ”€โ”€โ”€โ”€โ”€โ”€โ”€โ”€โ”€โ”€โ”€โ”€โ”€โ”€โ”€โ”€โ”€โ”€โ”€โ”€โ”€โ”€โ”€โ”€โ”€โ”€โ”€โ”€โ”€โ”€โ”€โ”€โ”€โ”€โ”€โ”€โ”€โ”€โ”€โ”€โ”€โ”€โ”€โ”€โ”€โ”€โ”€โ”€โ”€โ”€โ”€โ”€โ”€โ”€โ”€โ”€โ”€โ”€โ”€โ”€โ”€โ”€โ”€โ”€โ”€โ”€โ”€โ”€โ”€โ”€โ”€โ”€โ”€โ”€โ”€โ”€โ”€โ”€โ”€โ”€โ”€โ”€โ”€โ”€โ”€โ”€โ”€โ”€โ”€โ”€โ”€โ”€โ”€โ”€โ”€โ”€โ”€โ”€โ”€โ”€โ”€โ”€โ”€โ”€โ”€โ”€โ”€โ”€โ”€โ”€โ”€โ”€โ”€โ”€โ”€โ”€โ”€โ”€โ”€โ”€โ”€โ”€โ”€โ”€โ”€โ”€โ”€โ”€โ”€โ”€โ”€โ”€โ”€โ”€โ”€โ”€โ”€โ”€โ”€โ”€โ”€โ”€โ”€โ”€โ”€โ”€โ”€โ”€โ”€โ”€โ”€โ”€โ”€โ”€โ”€โ”€โ”€โ”€โ”€โ”€โ”€โ”€โ”€โ”€โ”€โ”€โ”€โ”€โ”€โ”€โ”€โ”€โ”€โ”€โ”€โ”€โ”€โ”€โ”€โ”€โ”€โ”€โ”€โ”€โ”€โ”€โ”€โ”€โ”€โ”€โ”€โ”€โ”€โ”€โ”€โ”€โ”€โ”€โ”€โ”€โ”€โ”€โ”€โ”€โ”€โ”€โ”€โ”€โ”€โ”€โ”€โ”€โ”€
  512.08kB  2.89% 88.42%   512.08kB  2.89%  regexp.compile
(pprof) top
Showing nodes accounting for 15643.65kB, 88.42% of 17691.72kB total
Showing top 10 nodes out of 60
      flat  flat%   sum%        cum   cum%
 5488.12kB 31.02% 31.02%  5488.12kB 31.02%  github.com/goccy/go-json/internal/decoder.init.0
 3786.34kB 21.40% 52.42%  3786.34kB 21.40%  github.com/elastic/beats/v7/libbeat/asset.GetFields
 2756.97kB 15.58% 68.01%  2756.97kB 15.58%  github.com/goccy/go-json/internal/encoder.init.0
  522.06kB  2.95% 70.96%   522.06kB  2.95%  cloud.google.com/go/pubsub/apiv1/pubsubpb.init
  522.06kB  2.95% 73.91%   522.06kB  2.95%  github.com/googleapis/gnostic/openapiv2.init
  517.33kB  2.92% 76.83%   517.33kB  2.92%  regexp/syntax.(*compiler).inst
  513.31kB  2.90% 79.73%   513.31kB  2.90%  google.golang.org/protobuf/internal/filedesc.(*File).initDecls
  512.88kB  2.90% 82.63%   512.88kB  2.90%  google.golang.org/protobuf/internal/strs.(*Builder).grow
  512.50kB  2.90% 85.53%   512.50kB  2.90%  runtime.allocm
  512.08kB  2.89% 88.42%   512.08kB  2.89%  regexp.compile
(pprof)
โ”€โ”€โ”€โ”€โ”€โ”€โ”€โ”€โ”€โ”€โ”€โ”€โ”€โ”€โ”€โ”€โ”€โ”€โ”€โ”€โ”€โ”€โ”€โ”€โ”€โ”€โ”€โ”€โ”€โ”€โ”€โ”€โ”€โ”€โ”€โ”€โ”€โ”€โ”€โ”€โ”€โ”€โ”€โ”€โ”€โ”€โ”€โ”€โ”€โ”€โ”€โ”€โ”€โ”€โ”€โ”€โ”€โ”€โ”€โ”€โ”€โ”€โ”€โ”€โ”€โ”€โ”€โ”€โ”€โ”€โ”€โ”€โ”€โ”€โ”€โ”€โ”€โ”€โ”€โ”€โ”€โ”€โ”€โ”€โ”€โ”€โ”€โ”€โ”€โ”€โ”€โ”€โ”€โ”€โ”€โ”€โ”€โ”€โ”€โ”€โ”€โ”€โ”€โ”€โ”€โ”€โ”€โ”€โ”€โ”€โ”€โ”€โ”€โ”€โ”€โ”€โ”€โ”€โ”€โ”€โ”€โ”€โ”€โ”€โ”€โ”€โ”€โ”€โ”€โ”€โ”€โ”€โ”€โ”€โ”€โ”€โ”€โ”€โ”€โ”€โ”€โ”€โ”€โ”€โ”€โ”€โ”€โ”€โ”€โ”€โ”€โ”€โ”€โ”€โ”€โ”€โ”€โ”€โ”€โ”€โ”€โ”€โ”€โ”€โ”€โ”€โ”€โ”€โ”€โ”€โ”€โ”€โ”€โ”€โ”€โ”€โ”€โ”€โ”€โ”€โ”€โ”€โ”€โ”€โ”€โ”€โ”€โ”€โ”€โ”€โ”€โ”€โ”€โ”€โ”€โ”€โ”€โ”€โ”€โ”€โ”€โ”€โ”€โ”€โ”€โ”€โ”€โ”€โ”€โ”€โ”€โ”€โ”€โ”€โ”€โ”€โ”€โ”€โ”€โ”€โ”€โ”€โ”€โ”€โ”€โ”€โ”€โ”€โ”€โ”€โ”€โ”€โ”€โ”€โ”€โ”€โ”€โ”€โ”€โ”€โ”€โ”€โ”€โ”€โ”€โ”€โ”€โ”€โ”€โ”€โ”€โ”€โ”€
Entering interactive mode (type "help" for commands, "o" for options)
(pprof) top
Showing nodes accounting for 10ms, 100% of 10ms total
Showing top 10 nodes out of 22
      flat  flat%   sum%        cum   cum%
      10ms   100%   100%       10ms   100%  runtime/internal/syscall.Syscall6
         0     0%   100%       10ms   100%  github.com/elastic/beats/v7/libbeat/api.makeAPIHandler.func1
         0     0%   100%       10ms   100%  github.com/elastic/elastic-agent-libs/monitoring.(*Func).Visit
         0     0%   100%       10ms   100%  github.com/elastic/elastic-agent-libs/monitoring.(*Registry).Visit (inline)
         0     0%   100%       10ms   100%  github.com/elastic/elastic-agent-libs/monitoring.(*Registry).doVisit
         0     0%   100%       10ms   100%  github.com/elastic/elastic-agent-libs/monitoring.CollectStructSnapshot
         0     0%   100%       10ms   100%  github.com/elastic/elastic-agent-system-metrics/metric/system/host.ReportInfo.func1
         0     0%   100%       10ms   100%  github.com/elastic/go-sysinfo.Host
         0     0%   100%       10ms   100%  github.com/elastic/go-sysinfo/providers/linux.(*reader).network
         0     0%   100%       10ms   100%  github.com/elastic/go-sysinfo/providers/linux.linuxSystem.Host

HEAP a second before MEM reaching 6 GB CAP and reseting

very 2.0s: systemctl status filebeat                                                                                                                                                                     HOSTNAME: Thu Mar  7 15:55:55 2024

โ— filebeat.service - Filebeat sends log files to Logstash or directly to Elasticsearch.
   Loaded: loaded (/usr/lib/systemd/system/filebeat.service; enabled; vendor preset: disabled)
   Active: active (running) since Thu 2024-03-07 15:55:54 CET; 1s ago
     Docs: https://www.elastic.co/beats/filebeat
 Main PID: 331174 (filebeat)
    Tasks: 8 (limit: 74760)
   Memory: 121.4M (max: 6.0G)
   CGroup: /system.slice/filebeat.service
           โ””โ”€331174 /usr/share/filebeat/bin/filebeat --environment systemd -c /etc/filebeat/filebeat.yml --path.home /usr/share/filebeat --path.config /etc/filebeat --path.data /var/lib/filebeat --path.logs /var/log/filebeat

Mar 07 15:55:54 HOSTNAME systemd[1]: filebeat.service: Service RestartSec=100ms expired, scheduling restart.
Mar 07 15:55:54 HOSTNAME systemd[1]: filebeat.service: Scheduled restart job, restart counter is at 7.
Mar 07 15:55:54 HOSTNAME systemd[1]: Stopped Filebeat sends log files to Logstash or directly to Elasticsearch..
Mar 07 15:55:54 HOSTNAME systemd[1]: Started Filebeat sends log files to Logstash or directly to Elasticsearch..
โ”€โ”€โ”€โ”€โ”€โ”€โ”€โ”€โ”€โ”€โ”€โ”€โ”€โ”€โ”€โ”€โ”€โ”€โ”€โ”€โ”€โ”€โ”€โ”€โ”€โ”€โ”€โ”€โ”€โ”€โ”€โ”€โ”€โ”€โ”€โ”€โ”€โ”€โ”€โ”€โ”€โ”€โ”€โ”€โ”€โ”€โ”€โ”€โ”€โ”€โ”€โ”€โ”€โ”€โ”€โ”€โ”€โ”€โ”€โ”€โ”€โ”€โ”€โ”€โ”€โ”€โ”€โ”€โ”€โ”€โ”€โ”€โ”€โ”€โ”€โ”€โ”€โ”€โ”€โ”€โ”€โ”€โ”€โ”€โ”€โ”€โ”€โ”€โ”€โ”€โ”€โ”€โ”€โ”€โ”€โ”€โ”€โ”€โ”€โ”€โ”€โ”€โ”€โ”€โ”€โ”€โ”€โ”€โ”€โ”€โ”€โ”€โ”€โ”€โ”€โ”€โ”€โ”€โ”€โ”€โ”€โ”€โ”€โ”€โ”€โ”€โ”€โ”€โ”€โ”€โ”€โ”€โ”€โ”€โ”€โ”€โ”€โ”€โ”€โ”€โ”€โ”€โ”€โ”€โ”€โ”€โ”€โ”€โ”€โ”€โ”€โ”€โ”€โ”€โ”€โ”€โ”€โ”€โ”€โ”€โ”€โ”€โ”€โ”€โ”€โ”€โ”€โ”€โ”€โ”€โ”€โ”€โ”€โ”€โ”€โ”€โ”€โ”€โ”€โ”€โ”€โ”€โ”€โ”€โ”€โ”€โ”€โ”€โ”€โ”€โ”€โ”€โ”€โ”€โ”€โ”€โ”€โ”€โ”€โ”€โ”€โ”€โ”€โ”€โ”€โ”€โ”€โ”€โ”€โ”€โ”€โ”€โ”€โ”€โ”€โ”€โ”€โ”€โ”€โ”€โ”€โ”€โ”€โ”€โ”€โ”€โ”€โ”€โ”€โ”€โ”€โ”€โ”€โ”€โ”€โ”€โ”€โ”€โ”€โ”€โ”€โ”€โ”€โ”€โ”€โ”€โ”€โ”€โ”€โ”€โ”€โ”€โ”€
.bash_history                        .cache/                              elks-kibana-hearbteat.pub            pprof/                               .ssh/
.bash_logout                         .config/                             .local/                              .python_history                      teraz-do-pobrania-heartbeat/
.bash_profile                        eclipse-jee-neon-3-win32-x86_64.zip  logstash/                            scripts/
[HOSTNAME]~$ watch sudo tail /var/log/filebeat/filebeat-20240307-236.ndjson
alerts/                              .bashrc                              elks-kibana-hearbteat                metricbeat-8.10.2-x86_64.rpm         sftp/
.bash_history                        .cache/                              elks-kibana-hearbteat.pub            pprof/                               .ssh/
.bash_logout                         .config/                             .local/                              .python_history                      teraz-do-pobrania-heartbeat/
.bash_profile                        eclipse-jee-neon-3-win32-x86_64.zip  logstash/                            scripts/
[HOSTNAME]~$ watch sudo tail /var/log/filebeat/filebeat-20240307-2
filebeat-20240307-234.ndjson  filebeat-20240307-235.ndjson  filebeat-20240307-236.ndjson  filebeat-20240307-237.ndjson  filebeat-20240307-238.ndjson  filebeat-20240307-239.ndjson  filebeat-20240307-240.ndjson  filebeat-20240307-241.ndjson
[HOSTNAME]~$ watch sudo tail /var/log/filebeat/filebeat-20240307-241.ndjson
[HOSTNAME]~$ sudo vi /etc/filebeat/filebeat.yml
[HOSTNAME]~$ sudo systemctl restart filebeat
[HOSTNAME]~$
โ”€โ”€โ”€โ”€โ”€โ”€โ”€โ”€โ”€โ”€โ”€โ”€โ”€โ”€โ”€โ”€โ”€โ”€โ”€โ”€โ”€โ”€โ”€โ”€โ”€โ”€โ”€โ”€โ”€โ”€โ”€โ”€โ”€โ”€โ”€โ”€โ”€โ”€โ”€โ”€โ”€โ”€โ”€โ”€โ”€โ”€โ”€โ”€โ”€โ”€โ”€โ”€โ”€โ”€โ”€โ”€โ”€โ”€โ”€โ”€โ”€โ”€โ”€โ”€โ”€โ”€โ”€โ”€โ”€โ”€โ”€โ”€โ”€โ”€โ”€โ”€โ”€โ”€โ”€โ”€โ”€โ”€โ”€โ”€โ”€โ”€โ”€โ”€โ”€โ”€โ”€โ”€โ”€โ”€โ”€โ”€โ”€โ”€โ”€โ”€โ”€โ”€โ”€โ”€โ”€โ”€โ”€โ”€โ”€โ”€โ”€โ”€โ”€โ”€โ”€โ”€โ”€โ”€โ”€โ”€โ”€โ”€โ”€โ”€โ”€โ”€โ”€โ”€โ”€โ”€โ”€โ”€โ”€โ”€โ”€โ”€โ”€โ”€โ”€โ”€โ”€โ”€โ”€โ”€โ”€โ”€โ”€โ”€โ”€โ”€โ”€โ”€โ”€โ”€โ”€โ”€โ”€โ”€โ”€โ”€โ”€โ”€โ”€โ”€โ”€โ”€โ”€โ”€โ”€โ”€โ”€โ”€โ”€โ”€โ”€โ”€โ”€โ”€โ”€โ”€โ”€โ”€โ”€โ”€โ”€โ”€โ”€โ”€โ”€โ”€โ”€โ”€โ”€โ”€โ”€โ”€โ”€โ”€โ”€โ”€โ”€โ”€โ”€โ”€โ”€โ”€โ”€โ”€โ”€โ”€โ”€โ”€โ”€โ”€โ”€โ”€โ”€โ”€โ”€โ”€โ”€โ”€โ”€โ”€โ”€โ”€โ”€โ”€โ”€โ”€โ”€โ”€โ”€โ”€โ”€โ”€โ”€โ”€โ”€โ”€โ”€โ”€โ”€โ”€โ”€โ”€โ”€โ”€โ”€โ”€โ”€โ”€โ”€
Type: inuse_space
Time: Mar 7, 2024 at 3:55pm (CET)
Entering interactive mode (type "help" for commands, "o" for options)
(pprof) top
Showing nodes accounting for 3.66GB, 97.97% of 3.73GB total
Dropped 323 nodes (cum <= 0.02GB)
      flat  flat%   sum%        cum   cum%
    3.66GB 97.97% 97.97%     3.66GB 97.97%  github.com/elastic/beats/v7/filebeat/inputsource/common/dgram.DatagramReaderFactory.func1.1
         0     0% 97.97%     0.03GB  0.76%  github.com/elastic/beats/v7/filebeat/beater.(*countingClient).Publish
         0     0% 97.97%     3.66GB 97.97%  github.com/elastic/beats/v7/filebeat/inputsource/common/dgram.(*Listener).Start.func1
         0     0% 97.97%     3.66GB 97.97%  github.com/elastic/beats/v7/filebeat/inputsource/common/dgram.(*Listener).connectAndRun
         0     0% 97.97%     0.03GB  0.76%  github.com/elastic/beats/v7/libbeat/publisher/pipeline.(*client).Publish
         0     0% 97.97%     0.03GB  0.76%  github.com/elastic/beats/v7/libbeat/publisher/pipeline.(*client).publish
         0     0% 97.97%     0.03GB  0.76%  github.com/elastic/beats/v7/libbeat/publisher/processing.(*group).Run
         0     0% 97.97%     3.66GB 97.99%  github.com/elastic/go-concert/unison.(*TaskGroup).Go.func1

After encountering significant performance issues and memory leaks with Filebeat when processing high volumes of logs, especially with the Fortinet module enabled, I made several configuration changes to address the bottleneck caused by the in-memory queue.

The root cause seemed to be that events were being processed too slowly, regardless of the worker or other settings, leading to a backlog in the memory queue. To alleviate this, I switched to using the disk-based queue (queue.disk) instead of the in-memory queue (queue.mem). This change alone didn't provide a complete solution, but it did improve the throughput.

The problem with the memory queue was that events were flushed too slowly, irrespective of the worker configuration or other settings. Changing the values of output.elasticsearch.worker (5/10/20/40/100) had an unpredictable effect on performance. Increasing the number of workers did not significantly improve the results. This raises the question of whether the worker thread performance was limited by the number of CPU cores or threads available.

Reducing the queue.flush.timeout to 10ms(0/1/100) provided better results but did not ensure queue stability, as the queue size continued to grow(but slower with some configurations). Ultimately, switching to the disk-based queue resolved the problem.

After all the testes i got this:

output.elasticsearch:
...
  worker: 40
  bulk_max_size: 10000
  compression_level: 2

queue.disk:
  max_size: 15GB

Filebeat stopped consuming excessive amounts of memory. While it still consumes some memory, it no longer queues events in RAM and gets overwhelmed during log surges or restarts. Now, when there are more events to process, they are handled more efficiently using the disk-based queue.

With these changes, I observed the following improvements:

  • Filebeat's memory consumption stabilized, although it still uses some memory, but it no longer causes a memory leak.
  • The number of logs processed increased by approximately 40%.
  • Filebeat can now handle a stable peak throughput of 12,000 events/second(i guess if iops will be not a problem it should get to 30k/s on this 2 cpu 12 GB).
  • CPU usage increased by around 20% on a 2-core CPU(stable 60% now).
  • using filestream instead of input helped with stability
  • The write iops skyrocketed(it is an issue i will further investigate)

Filebeat


Elasticsearch


My remaining question is whether the number of processors and threads has any significance with this disk-based queue configuration, given the unpredictable effects observed when adjusting the worker thread count with the in-memory queue configuration?

It was better after changing to the disk queue but still not perfect. After adding 2 cores up to 4 total. All problems stopped. Final number of
output.elasticsearch.wokers : 5

I had to add also 2 CPU to elasticserach node 8 -> 10

Setting the max bulk size that high without changing other settings is essentially a no-op on pre-8.12. I believe the highest value that will make a difference without modifying other queue settings is 2048.

We made significant improvement to the default queue and output settings in 8.12 for beats and introduced new performance presets that make optimizing for throughput very easy.

I would first upgrade to 8.12 and remove the configured output and memory settings.

If you still have performance issues with the new defaults I would recommend setting the output to optimize for throughput:

output.elasticsearch:
  hosts: ["http://yourhost:9200"]
  preset: throughput
2 Likes

Hello @strawgate thank you for your reply. I have just read your response and wanted to make sure I understand. So you suggest moving to 8.12+ and removing all workers/max_bulk_size and queue settings and just using the "preset: throughput" option instead right?

For the update.

The changes that I made before when resolving this issue hold strong. When facing with a spike in traffic filebeat works perfectly without hangouts/restarts/crashes

I will update the stack to the new version 8.12+ in the coming weeks.

Yes, that is what i would recommend starting with and reporting back the results!

1 Like

Hi, I updated Filebeat to 8.13.2 and change the configuration but it wasn't working well. Filebeat couldn't emit events fast enough(was x10 times slower).

I stayed with

output.elasticsearch:
  pipeline: filebeat-pipeline
  bulk_max_size: 20000
  #preset: throughput
  compression_level: 1


queue.disk:
  max_size: 25GB
  write_ahead: 16384  
  read_ahead: 8192

That would be unexpected, if you'd like me to take a look id just need the config you tried and a Filebeat log while is under load for a minute or so.

Hello @strawgate

here is a current config

###################### Filebeat Configuration Example #########################

# This file is an example configuration file highlighting only the most common
# options. The filebeat.reference.yml file from the same directory contains all the
# supported options with more comments. You can use it as a reference.
#
# You can find the full configuration reference here:
# https://www.elastic.co/guide/en/beats/filebeat/index.html

# For more available modules and options, please see the filebeat.reference.yml sample
# configuration file.

logging.level: debug

logging.to_files: true
logging.to_stderr: false
logging.selectors: ["publish", "elasticsearch"]
#logging.selectors: ["fortinet","harvester","netflow", "input"]

logging.files:
  path: /var/log/filebeat
  name: filebeat
  keepfiles: 0
  permissions: 0644
  rotateeverybytes: 1073741824

# FOR MEM ERRORS TEST
#filebeat.publish_async: false

#=========================== Filebeat inputs Custom  =============================

filebeat.inputs:
- type: filestream
  id: "some id"
  enabled: true
  paths:
    - /var/log/*.log
  # The 'harvester_limit' has no direct equivalent in 'filestream' but you can control worker and reader settings.
  scan_frequency: 30s
#=========================== Filebeat inputs =============================
#filebeat.inputs:

# Each - is an input. Most options can be set at the input level, so
# you can use different inputs for various configurations.
# Below are the input specific configurations.


#- type: log

#  scan_frequency: 10s
#  harvester_limit: 50
#  backoff: 2s
#  max_backoff: 10s
#  backoff_factor: 2

  # Change to true to enable this input configuration.
#  enabled: true

  # Paths that should be crawled and fetched. Glob based paths.
#  paths:
#    - /var/log/filebeat/*.log
    #- c:\programdata\elasticsearch\logs\*

  # Exclude lines. A list of regular expressions to match. It drops the lines that are
  # matching any regular expression from the list.
  #exclude_lines: ['^DBG']

  # Include lines. A list of regular expressions to match. It exports the lines that are
  # matching any regular expression from the list.
  #include_lines: ['^ERR', '^WARN']

  # Exclude files. A list of regular expressions to match. Filebeat drops the files that
  # are matching any regular expression from the list. By default, no files are dropped.
  #exclude_files: ['.gz$']

  # Optional additional fields. These fields can be freely picked
  # to add additional information to the crawled log files for filtering
  #fields:

#  level: debug
  #  review: 1

  ### Multiline options

  # Multiline can be used for log messages spanning multiple lines. This is common
  # for Java Stack Traces or C-Line Continuation

  # The regexp Pattern that has to be matched. The example pattern matches all lines starting with [
  #multiline.pattern: ^\[

  # Defines if the pattern set under pattern should be negated or not. Default is false.
  #multiline.negate: false

  # Match can be set to "after" or "before". It is used to define if lines should be append to a pattern
  # that was (not) matched before or after or as long as a pattern is not matched based on negate.
  # Note: After is the equivalent to previous and before is the equivalent to to next in Logstash
  #multiline.match: after


#============================= Filebeat modules ===============================

filebeat.config.modules:
  # Glob pattern for configuration loading
  path: ${path.config}/modules.d/*.yml

  # Set to true to enable config reloading
  reload.enabled: True

  # Period on which files under path should be checked for changes
  reload.period: 60s

#==================== Elasticsearch template setting ==========================

setup.template.settings:
  index.number_of_shards: 1
  index.number_of_replicas: 0
  #index.final_pipeline:
  index.codec: best_compression
  _source.enabled: true

#================================ General =====================================

# The name of the shipper that publishes the network data. It can be used to group
# all the transactions sent by a single shipper in the web interface.
#name:

# The tags of the shipper are included in their own field with each
# transaction published.
#tags: ["service-X", "web-tier"]

# Optional fields that you can specify to add additional information to the
# output.
#fields:
#  env: staging


#============================== Dashboards =====================================
# These settings control loading the sample dashboards to the Kibana index. Loading
# the dashboards is disabled by default and can be enabled either by setting the
# options here or by using the `setup` command.
#setup.dashboards.enabled: false

# The URL from where to download the dashboards archive. By default this URL
# has a value which is computed based on the Beat name and version. For released
# versions, this URL points to the dashboard archive on the artifacts.elastic.co
# website.
#setup.dashboards.url:

#============================== Kibana =====================================


#============================= Elastic Cloud ==================================

# These settings simplify using Filebeat with the Elastic Cloud (https://cloud.elastic.co/).

# The cloud.id setting overwrites the `output.elasticsearch.hosts` and
# `setup.kibana.host` options.
# You can find the `cloud.id` in the Elastic Cloud web UI.
#cloud.id:

# The cloud.auth setting overwrites the `output.elasticsearch.username` and
# `output.elasticsearch.password` settings. The format is `<user>:<pass>`.
#cloud.auth:

#================================ Outputs =====================================

# Configure what output to use when sending the data collected by the beat.

#-------------------------- Elasticsearch output ------------------------------
output.elasticsearch:
  # Array of hosts to connect to.
  hosts: ["https://url:9200"]
  username: "${ES_LOG}"
  password: "${ES_PWD}"
  ssl.certificate_authorities: ["path/elastic-ca.crt"]
  ssl.certificate: "/path/beats.crt"
  ssl.key: "path/beats.key"
  ssl.key_passphrase: "${KEY_PWD}"
  ssl.verification_mode: "full"
#  proxy_disable: true
  pipeline: filebeat-pipeline
  worker: 5
#  flush.interval: 1s
  bulk_max_size: 20000
  #preset: throughput
  compression_level: 1
  indices:

    - index: "filebeat-%{[agent.version]}-netflow-%{+yyyy.MM.dd}"
      when.equals:
        event.module: "netflow"

    - index: "filebeat-%{[agent.version]}-cisco-%{+xxxx.ww}"
      when.equals:
        event.module: "cisco"

    - index: "filebeat-%{[agent.version]}-system-%{+xxxx.ww}"
      when.equals:
        event.module: "system"

    - index: "filebeat-%{[agent.version]}-elasticsearch-%{+xxxx.ww}"
      when.equals:
        event.module: "elasticsearch"

    - index: "filebeat-%{[agent.version]}-fortinet-%{+yyyy.MM.dd}"
      when.equals:
        event.module: "fortinet"

#----------------------------- Logstash output --------------------------------
#output.logstash:
  # The Logstash hosts
  # hosts: ["localhost:5044"]

  # Optional SSL. By default is off.
  # List of root certificates for HTTPS server verifications
  #ssl.certificate_authorities: ["/path/ca.pem"]

  # Certificate for SSL client authentication
  #ssl.certificate: "/path/cert.pem"

  # Client Certificate Key
  #ssl.key: "/path/cert.key"

#================================ Processors =====================================

# Configure processors to enhance or manipulate events generated by the beat.

processors:
  - add_host_metadata: ~
#  - add_cloud_metadata: ~
#  - add_docker_metadata: ~
#  - add_kubernetes_metadata: ~
  - add_fields:
      target: ''
      fields:
        observer.name: "GCP"
      when.equals:
        event.dataset: "gcp.firewall"
  - drop_event:
      when.and:
        - equals:
            event.module: "netflow"
        - equals:
            network.transport: "icmp"
#================================ Logging =====================================

# Sets log level. The default log level is info.
# Available log levels are: error, warning, info, debug
logging.level: error

# At debug level, you can selectively enable logging only for some components.
# To enable all selectors use ["*"]. Examples of other selectors are "beat",
# "publish", "service".
#logging.selectors: ["*"]

#============================== X-Pack Monitoring ===============================
# filebeat can export internal metrics to a central Elasticsearch monitoring
# cluster.  This requires xpack monitoring to be enabled in Elasticsearch.  The
# reporting is disabled by default.

# Set to true to enable the monitoring reporter.
monitoring.enabled: false

# Sets the UUID of the Elasticsearch cluster under which monitoring data for this
# Filebeat instance will appear in the Stack Monitoring UI. If output.elasticsearch
# is enabled, the UUID is derived from the Elasticsearch cluster referenced by output.elasticsearch.
#monitoring.cluster_uuid: XXX

# Uncomment to send the metrics to Elasticsearch. Most settings from the
# Elasticsearch output are accepted here as well.
# Note that the settings should point to your Elasticsearch *monitoring* cluster.
# Any setting that is not set is automatically inherited from the Elasticsearch
# output configuration, so if you have the Elasticsearch output configured such
# that it is pointing to your Elasticsearch monitoring cluster, you can simply
# uncomment the following line.
#monitoring.elasticsearch:

#================================= Migration ==================================

# This allows to enable 6.7 migration aliases
#migration.6_to_7.enabled: true
#script.max_compilations_rate: 3000/5m
#script.cache_max_size: 1000
#bulk_max_size: 500
#pipeline.pipelining: 10
#pipeline.batch.size: 8192
#queue.mem:
#  events: 8196
#  flush.timeout: 1s

#queue.mem:
#  events: 10000
#  flush.min_events: 100
#  flush.timeout: 0s

queue.disk:
  max_size: 25GB
  write_ahead: 16384  # Increased from default (2048) for potential performance gain
  read_ahead: 8192

setup.ilm.enabled: false
setup.template.enabled: false
setup.dashboards.enabled: false
http:
  enabled: true
  host: 0.0.0.0
  port: 5066
http.pprof.enabled: true

Regarding the issue I had with Filebeat, it turned out that after the last changes which helped (disk queue), the problem was not with Filebeat itself. For the purpose of debugging Heartbeat, I set the logging level to 'info.' Heartbeat was logging too much, and the actual problem was with Rsyslog; its queue was maxed out. This is why I wasn't seeing the logs as I should have, and there was a lag of about 10 minutes in the logging time.

During this time on filebeat site I was switch only between those two set of settings

Working very well / reliable / high performance without memory issue

output.elasticsearch:
  worker: 5
  bulk_max_size: 20000
  #preset: throughput

queue.disk:
  max_size: 25GB
  write_ahead: 16384  
  read_ahead: 8192

Very low performance / high memory usage

output.elasticsearch:
  #worker: 5
  #bulk_max_size: 20000
  preset: throughput
  
#queue.disk:
# max_size: 25GB
#  write_ahead: 16384  
#  read_ahead: 8192

For me, the case is closed. If you really need or want the logs, I can manage to provide them

The elk stack is right now at version: 8.13.2

A big part of the benefits to the throughout preset are optimizations to the memory queue which you aren't using.

This seems to imply the issue is related to the usage of the memory queue which I'd definitely be interested in investigating.

You said that the Filebeat is reading primarily fortinet logs?

I'd love to see if I can reproduce this myself but I sold my home fortinet a year ago... so anything you'd be willing to share (config, sample logs, os platform) on here or over email would be a big help.

@strawgate Thank you for your response. Yes, this instance Is used primarily to fortinet logs and netflow flows. I will prepare as much insightful data as possible in the next two days and will follow up with an email.