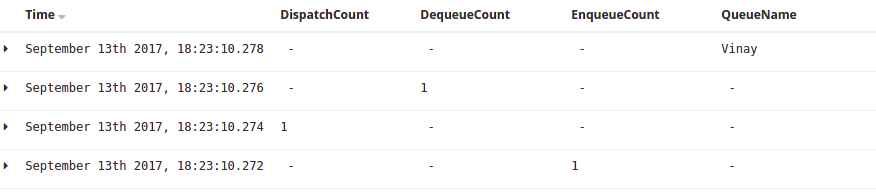
Now each row have different timestamp but each column field are related to each other. So i have to aggregate all these fields (DispatchCount, DequeueCount,EnqueueCount,QueueName) data into single table.
i am not sure i completely understand your problem, but you could try to create a table visualization and define the following metrics:
sum of DispatchCount
sum of DequeCount
sum of Enqueue Count
top 5 of QueueName
then for split rows select Date Histogram, with appropriate period (minute?)
you could also split rows by term, if there is another field that is common to all your rows that you would want to join, like 'host' or sth
We are having original data as mention in below screenshot. One metric_path having multiple fields(ActiveMQ.ActiveMQ.Name,ActiveMQ.ActiveMQ.Name, etc..).
We set different field name for each value by using filters
if ("DispatchCount" in [metric_path] ) {
ruby {
code => "event.set('DispatchCount' , event.get('metric_value_number') )"
}
}
We have created fields frm metric_path as mentioned in screenshot:
Apache, Apache Lucene, Apache Hadoop, Hadoop, HDFS and the yellow elephant
logo are trademarks of the
Apache Software Foundation
in the United States and/or other countries.