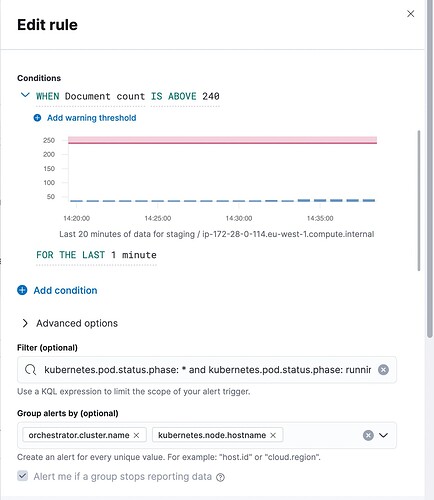
We have the following Prometheus alert:
count (
            kube_pod_info
            and on (pod, namespace, monitor) (
              kube_pod_status_phase{job="kube-state-metrics", phase="Running"} > 0
            )
          ) by (node, monitor) > 240
That will alert when the number of running pods on a node is above 240.
Is it possible to achieve the same in Kibana?
I tried with
but the problem is that the number of documents highly depends on the scrape interval and the aggregation interval and I can't reliably count the last scrape, while in Prometheus you can take the latest vector and count by it.
I tried to use the kubernetes.node.pod.allocatable.total and kubernetes.node.pod.capacity.total hoping these metrics can provide the information, but they both show the same value of 250 which is the specified capacity on the node and I couldn't find the number of currently running pods.
Do you have a way in Elastic Alerts that can allow us to implement alarms similar to the Prometheus one in the beginning?
