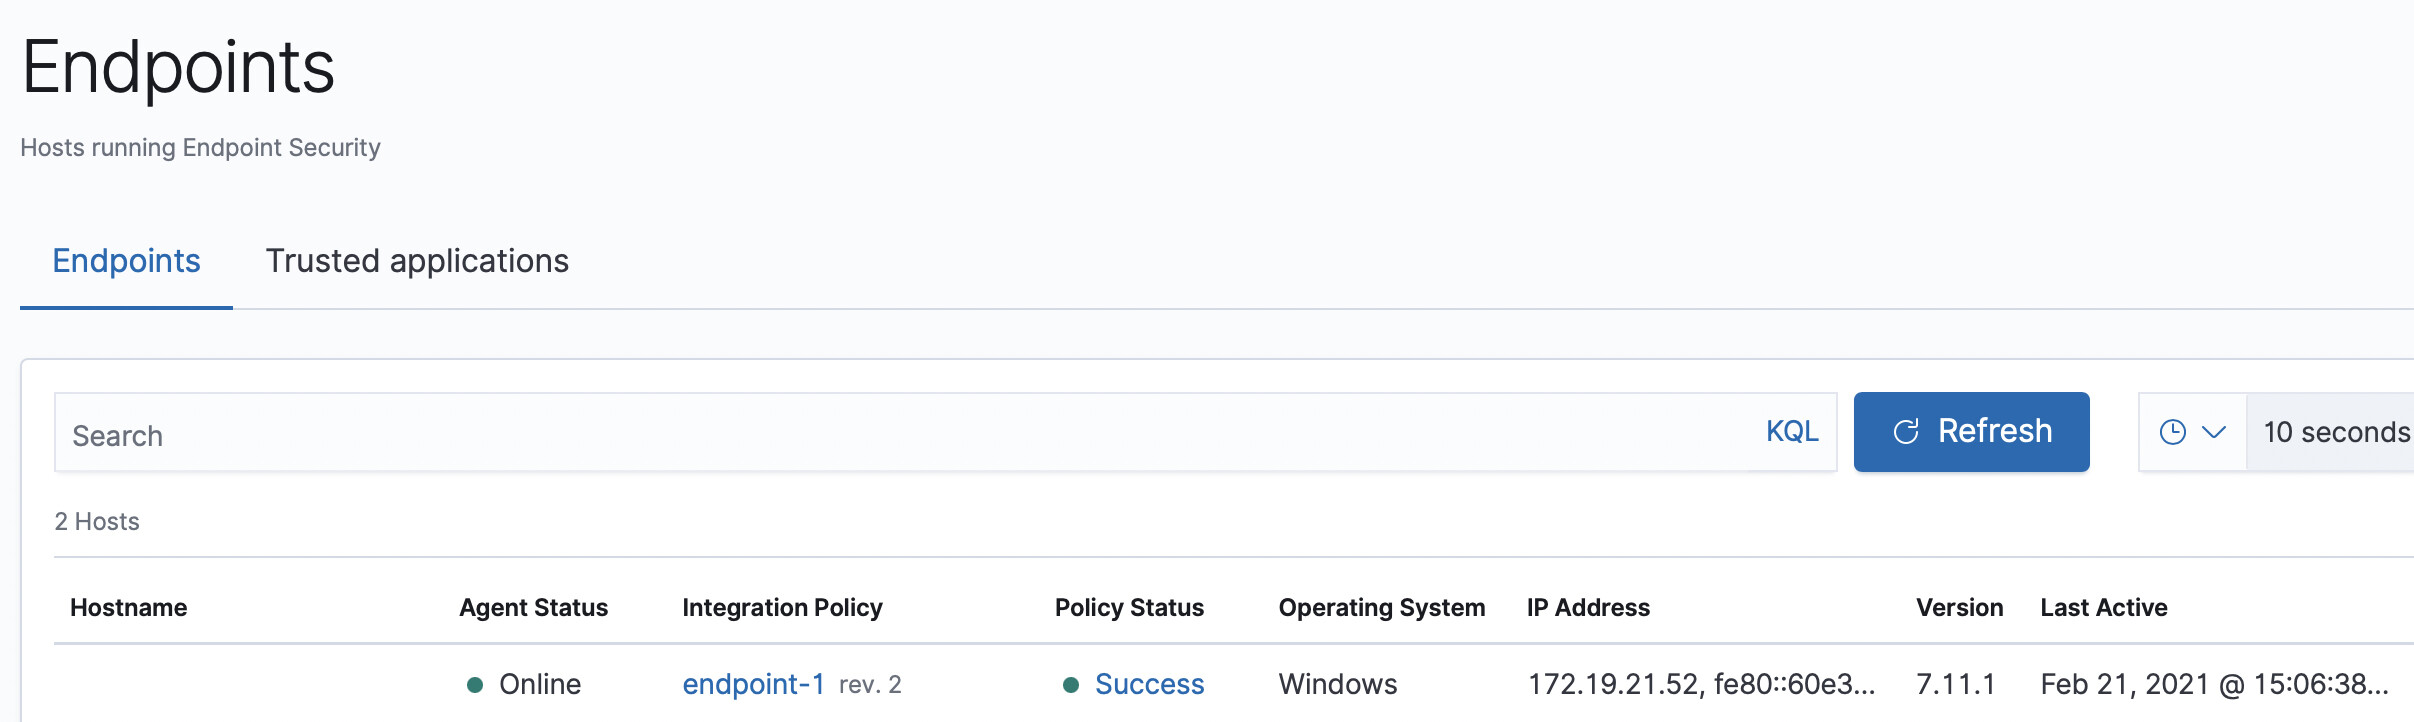
I've recently set up Elastic Search and Kibana 7.11 and enrolled a VM via Fleet and Agent.
In the process I set up a Policy and Assigned some detection rules as well as added the Security Endpoint Integration as well as System and Linux Integration.
Logs are being sent from the VM, however I'm having an issue where by when viewing Security > Detections > Detections > Manage detection rules, the rules I have activated are all getting a last response of fail and the issue all seem to be related to
The following index patterns did not match any indices: ["<some indicies>*"]
I rolled out my agent via fleet and manage it that way. Any help on the matter would be greatly appreciated
Yea that's correct, but the indices seem to be like they would of have been standard in the rollout of the agent, but I could be completely off with that.
For example for the Virtual Machine Fingerprinting Rule , the error is the following
The following index patterns did not match any indices: ["auditbeat-*","logs-endpoint.events.*"]
I did not edit any of the rules settings when adding them, nor have I created any custom rules
Thanks for the feedback. There has been over the last few days talks of us changing it to a softer UI/UX experience and error report rather than a hard error report so users are not taken back by some of the default rules showing errors and creating undue alarm (pun intended)
It's a bit tricky as we want to let users know when they have a rule that is never going to find something because of indexes that might have a misspelling or if the indexes just aren't showing up anymore vs. users being caught by surprise about default rules showing error conditions when the indexes will eventually be added.
Basically we have received feedback both directions:
Why isn't this rule firing? If I accidentally put in the wrong index name(s) or the index(es) don't exist, please let me know.
Why did these default rules have errors when I turn them on? I don't have the indexes just yet but I will very soon.
However, I think your expectation is that when default rules are activated even without default indexes being available you would get UI/UX hints about why they're not firing but not hard errors showing up? That part I think is the unexpected experience part we should work on?
Thanks Frank, your response there makes sense now as to what may going on. Seems I need to set up indexes to ensure I'm getting data into the rules, as they are not set up by default with the Endpoint Security Integration and Elastic Agent
In regards to UI/UX, I think what made me concerned as is out of the box it comes up as 'failed' for lastest response. Maybe something like 'missing index' might be more apt, even better, a warning with a link to how to configure indexes for rules when setting. Those are my 2 cents on the matter. Hope that provides some help to you and the Elastic Team
Hello @Frank_Hassanabad
I'm also facing this 'issue'. On 7.10 it was working without any changes needed but on a 7.11 instance after setting up the elastic security module and turning the endpoint rules on, I'm getting the same error and the endpoint module is not working (no response to eicar test file):
Unfortunately I have troubles what to do to make it work as it was working on 7.10 without doubt.
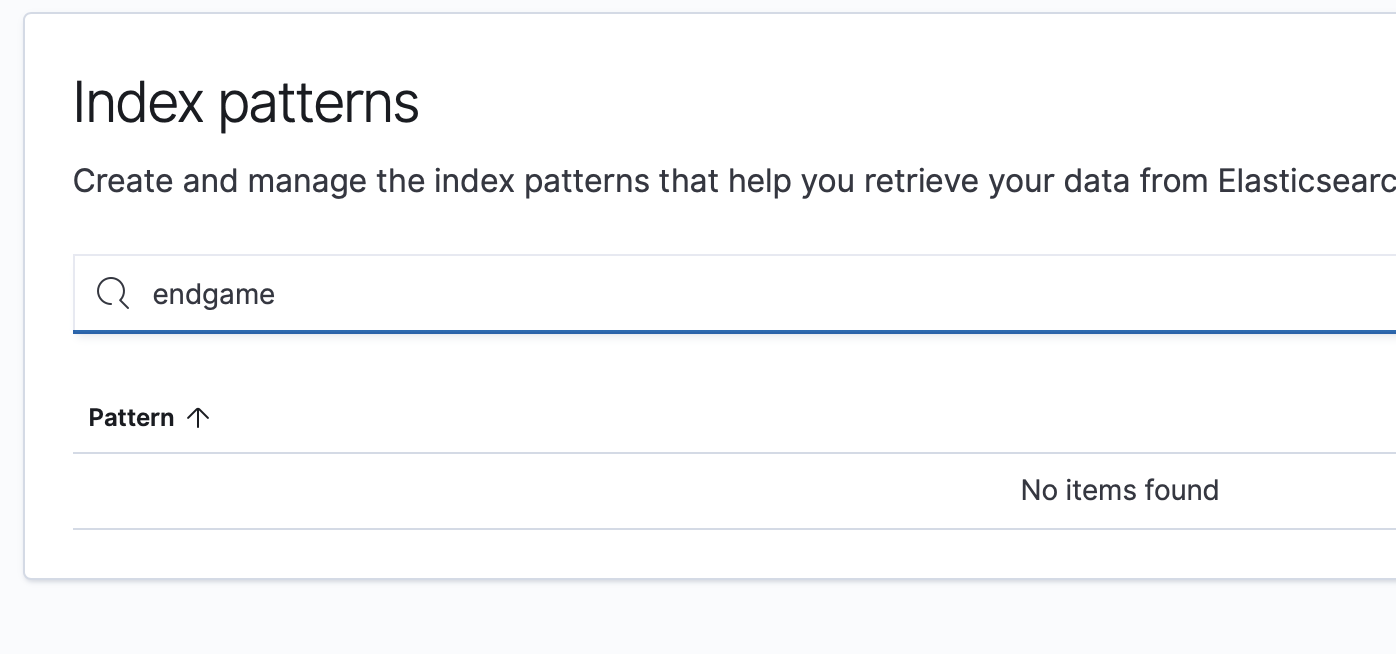
I cannot add any endgame-* indices as there are none:
Did you ever have endgame indexes though? Are they gone at this point? If they're in a different index you can clone the rule and change the index to use the one with the logs. Otherwise if you're not using endgame indexes you can simply turn off that rule or remove it altogether. In a small update we are going to make the error not has visible and just a warning.
No logs-endpoint.alerts-* are default created. Although the rule was working normally in 7.10 without any configuration, and there were no logs-endpoint.alerts-* indexes either.
It's a little bit confusing for me
Gotcha, the rule wasn't failing before when seeing an index which doesn't exist but that also means it will not find anything until that index does exist. There will probably be a change to make this into a softer warning but we still want to give UI/UX feedback that the alert running as is won't detect anything until data becomes available in case someone accidentally mistypes an index. The intention is let users know they will not have alerts until the data becomes available in the typed index.
Is there an easy option to create/configure those indexes? I have troubles finding the option, just wanna get default Elastic Security in 7.11 working
Also one more question, why was it working without aby configuration needed in 7.10? I installed the ELK, added some elastic agent on hosts and nothing more.
Hey Frank, is there any documentation on how to set up the Indexes for the rules? Still haven't been able to properly test the elastic agent yet with the rules due to this. Apologies still quite new to the ELK stack and elastic products, but can't seem to find any solution on line on how to create edit or update the indices for the Security Rules
So the question I have is what changes are required to get the endpoint detection rules pointing to the correct place? I can't seem to edit a rule definition, the tabs are greyed out.
If you are talking about the pre-packaged detection rules we ship with the security solution then you are correct, you cannot modify those. However, if you duplicate those prebuilt rules you can edit them however you please!
GET logs-endpoint.alerts-/_mapping
or
GET endgame-/_mapping
On 7.11.1 you should see an issue. Reponses = { }
It appears all the mappings are missing after upgrades from 7.10 and 7.10.2 upgrade to 7.11.1. At least 2 dev clusters for me have been this way. One dummy cluster with a single device talking to it another with 100~ devices talking to it.
Either the SIEM rules need to be updated to the "if new" new location which would be from upstream or every user that currently has 7.11.1 will have to do a manual modification to all Endpoint rules. Or the index needs to be recreated. Which to be honest isn't something some of us newer folks want to do...
Thanks, but will this allow me to the create indices for logs? All I am trying to do is to get the out-of-the-box siem solution working, which at the moment seems I need to create numerous index as per the fail towards the top of the post and Franks comments.
Seems from @PublicName comment below this worked fine and as expected in 7.10 and 7.10.2 and failed when upgrading to 7.11, which I am currently on
A solution I am looking for at the moment is
A) an easy way to recreate the indexes and some documentation on how to do so, so that the SIEM rules work out of the box
B) an update (or even roll back to 7.10.2) where the indexes are created when starting up the SIEM tool and configured with Fleet and Agent
I am happy to either rollback or upgrade (if an upgrade is coming in the very near future) if it's the most convenient.
However I would prefer to keep using the latest version if possible, but I am concerned, if adding indexes manually that It might break when a newer version of Elastic Stack is rolled out and would be wasted effort on my part if those issues between 7.10.2 and 7.11 were fixed in the latest update
Seems like the behaviour of the Detection Rules for Elastic Stack version 7.10.2 seems to work as expeceted where by when rules are added, they are 'succeeding' as described by @PublicName
My question is now, is that index error actually the case in this version of elastic stack (7.10.2) and just not notifying the user? as in will these rules always succeed as the index is not created and logs will never be captured thus rules will never be triggered?
So it seems in 7.11 the indices/index are broken and the rules point to something that doesn't exist. As pe the comment from @emmett.carey whats the best way to resolve it. Surely it can't be duplicating all the rules and re-pointing to the correct index?
@PublicName had an issue with an upgrade with Elastic Fleet which is not necessarily related to the apparent failures reported in this thread. Also I'm not sure the index patterns they provided are accurate. The thread they reference in fleet will figure that out and is a separate issue that is not related to the prepackaged rules.
I just want to set some baseline information for people who may come by this thread. The pre-packaged rules do not set up the indices in Elasticsearch. Our prepackaged rules are defined to search index patterns that are set up by either Beats or the Elastic Agent. Sometimes customers do not have the Beats or the correct integrations with Elastic Agent set up and as a result, some of the index patterns that our prepackaged rules search against do not exist.
Prior to 7.11 if the prepackaged rules were provided an index pattern that did not exist on a customer's cluster because the customer does not have an Elastic Agent integration set up or are not running Beats, the rules would run "successfully" despite these index patterns not existing on the system because they were never set up.
For instance if I run the following in dev tools
GET thisdoesnotexist*/_search
{
  "query": {
    "match_all": {}
  }
}
With 7.11 we introduced new error messaging for the rules to check that these index patterns do have concrete backing indices behind them. We also added a check to ensure that the user who defined these rules has read privileges to the provided index patterns. The failure you are seeing is something that, assuming no issues with fleet deleting your indices, was probably happening prior to 7.11 but was not showing as an error because there technically was no error in the response. When you query an index pattern that does not exist within Elasticsearch the result is an empty hit and not an error (like in the above example) so we were never going to report an error in that case.
With these checks we are now providing error messaging to help guide customers to make sure the backing requirements for the rules to truly be successful are set up properly.
Apache, Apache Lucene, Apache Hadoop, Hadoop, HDFS and the yellow elephant
logo are trademarks of the
Apache Software Foundation
in the United States and/or other countries.