If you are asking about a problem you are experiencing, please use the following template, as it will help us help you. If you have a different problem, please delete all of this text ![]()
Kibana version:
Docker 8.1.0
Elasticsearch version:
Docker 8.1.0
APM Server version:
Elastic Agent Fleet Server 8.1.0
APM Agent language and version:
Python Flask 6.8.1
Browser version:
Chrome 99
I have an existing installation of
Docker
Elasticsearch 7.17.1
Kibana 7.17.1
APM Server 7.17.1
I upgraded to 8.1.0 using
Docker
Elasticsearch 8.1.0 (docker.elastic.co/elasticsearch/elasticsearch:8.1.0)
Kibana 8.1.0 (docker.elastic.co/kibana/kibana:8.1.0)
APM Server 8.1.0 (docker.elastic.co/apm/apm-server:8.1.0)
Then I changed to use elastic agent with fleet server to swap out the above container
docker.elastic.co/beats/elastic-agent:8.1.0
apm events goes to Elasticsearch and shows up on the dashboard no problem
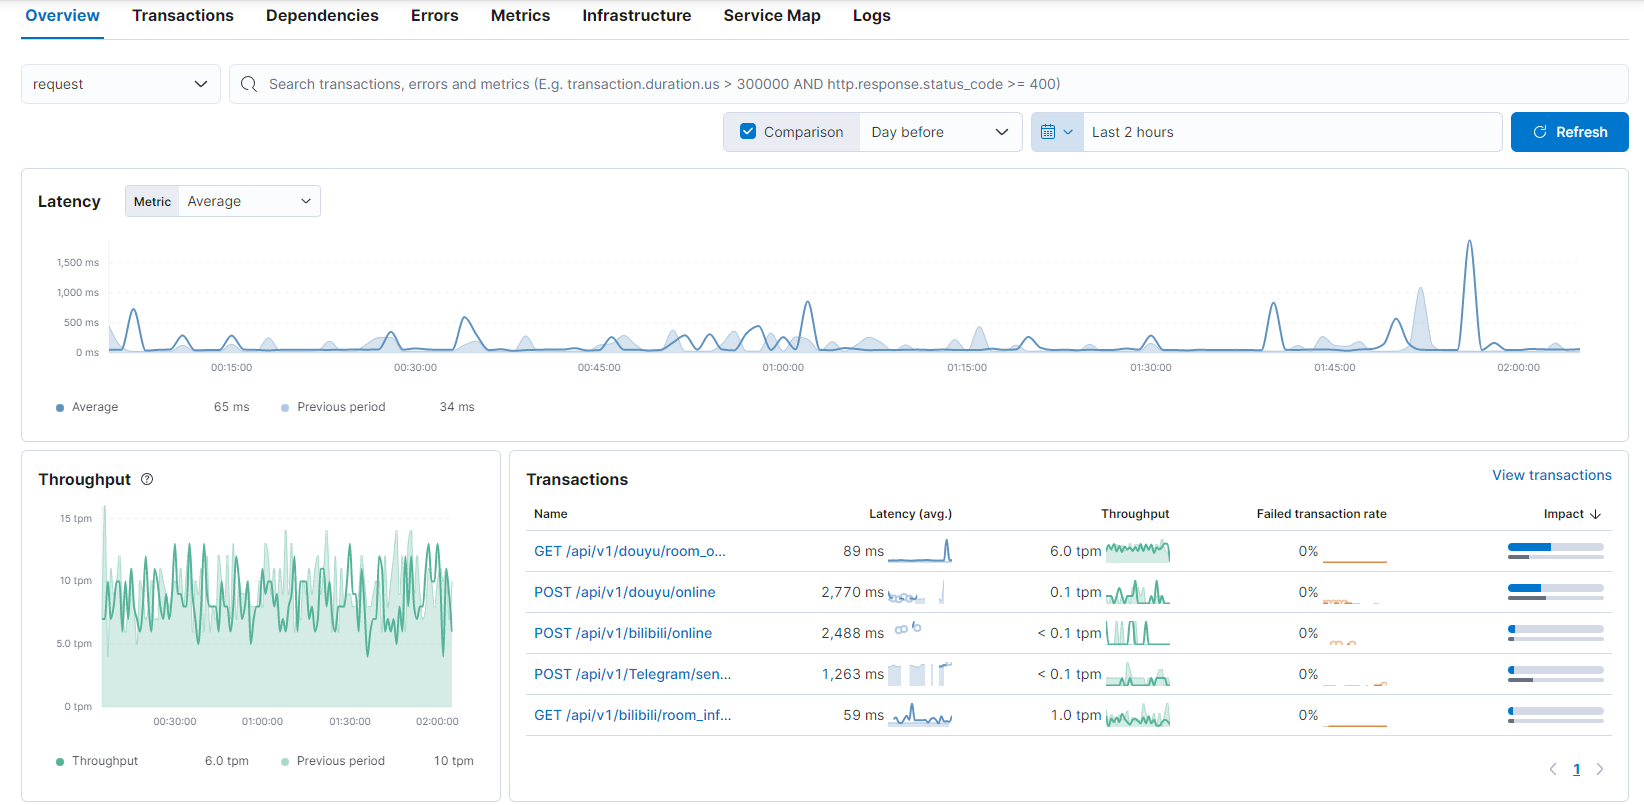
However, I cannot see the trace

I am able to see trace in the document

I can still see trace from earlier times which is ingested in 7.17.1

clicking on these two links doesnot show anything

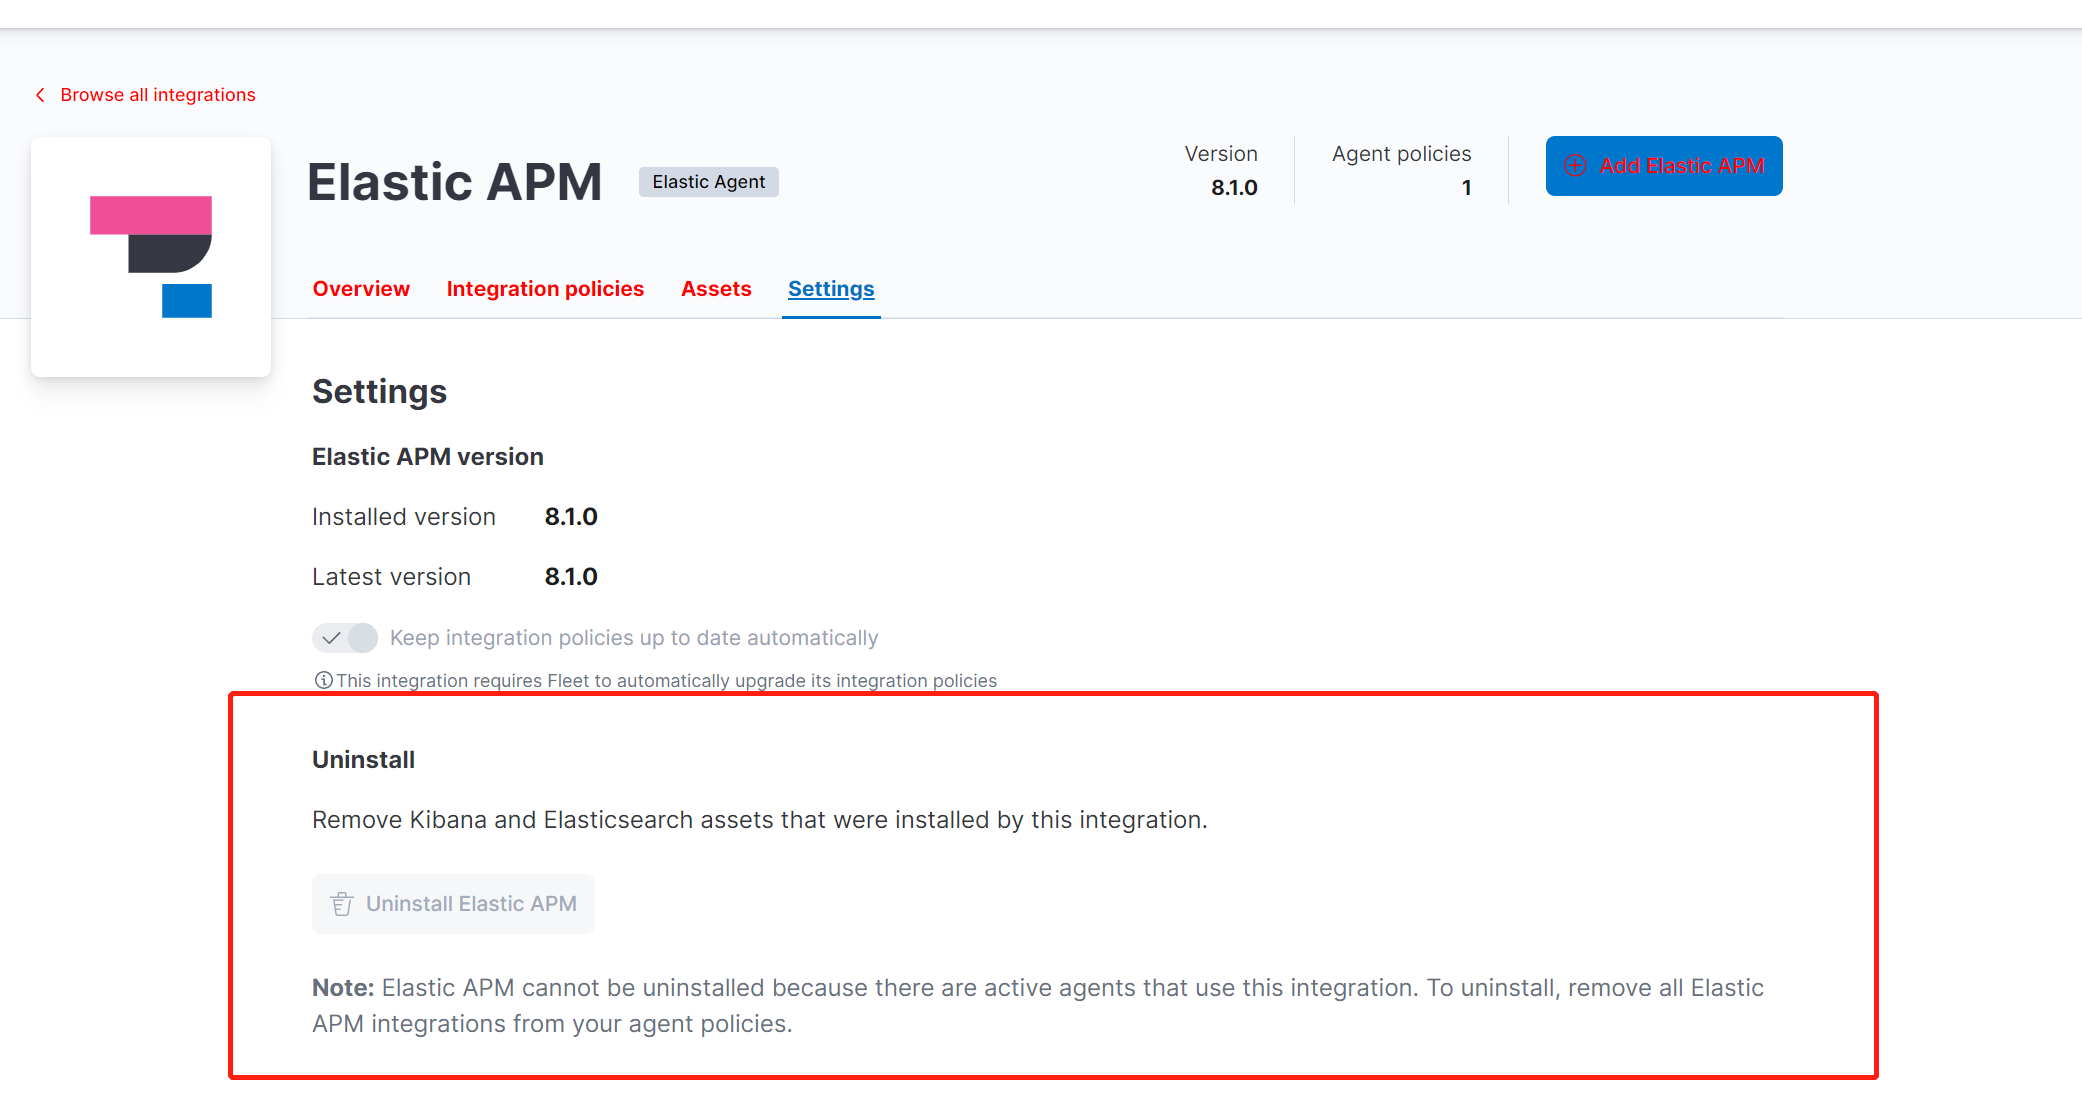
I have tried to uninstall APM integration, remove assets using this button and reinstall apm integration, still has the problem