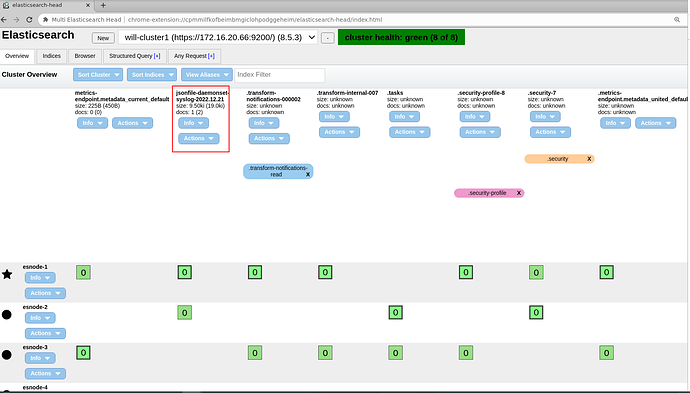
Thank you for your reply! The difficulty I encountered was that Logstash could not connect to the Elasticsearch cluster with Xpack enabled.
This is an Elasticsearch cluster composed of at least four node nodes, which enables xpack. I set a new certificate for the transport.ssl of this cluster and applied it in the configuration file.
The password of the certificate is 123456.
root@esnode-1:/etc/elasticsearch# cat /etc/hosts
127.0.0.1 localhost

172.16.20.66 esnode-1
172.16.20.60 esnode-2
172.16.20.105 esnode-3
172.16.100.28 esnode-4
172.16.20.87   logstash
root@esnode-1:/etc/elasticsearch#

root@esnode-1:~# cat elasticsearch.yml |grep -v '^$' | grep -v '^#'
cat: elasticsearch.yml: No such file or directory
root@esnode-1:~# cd /etc/elasticsearch
root@esnode-1:/etc/elasticsearch# cat elasticsearch.yml |grep -v '^$' | grep -v '^#'
cluster.name: will-cluster1
node.name: esnode-1
path.data: /data/elasticsearch
path.logs: /var/log/elasticsearch
network.host: 172.16.20.66
http.port: 9200
discovery.seed_hosts: ["esnode-1","esnode-2","esnode-3","esnode-4"]
cluster.initial_master_nodes: ["esnode-1","esnode-2","esnode-3","esnode-4"]
xpack.security.enabled: true
xpack.security.enrollment.enabled: true
xpack.security.http.ssl:
  enabled: true
  keystore.path: certs/http.p12
xpack.security.transport.ssl:
  enabled: true
  verification_mode: certificate
  keystore.path: certs/elastic-certificates.p12
  truststore.path: certs/elastic-certificates.p12
http.host: 0.0.0.0
root@esnode-1:/etc/elasticsearch# curl --cacert /etc/elasticsearch/certs/http_ca.crt -u elastic  https://localhost:9200
Enter host password for user 'elastic':
{
  "name" : "esnode-1",
  "cluster_name" : "will-cluster1",
  "cluster_uuid" : "5aT8AVA5STity523pJhvGQ",
  "version" : {
    "number" : "8.5.3",
    "build_flavor" : "default",
    "build_type" : "deb",
    "build_hash" : "4ed5ee9afac63de92ec98f404ccbed7d3ba9584e",
    "build_date" : "2022-12-05T18:22:22.226119656Z",
    "build_snapshot" : false,
    "lucene_version" : "9.4.2",
    "minimum_wire_compatibility_version" : "7.17.0",
    "minimum_index_compatibility_version" : "7.0.0"
  },
  "tagline" : "You Know, for Search"
}
/usr/share/elasticsearch/bin/elasticsearch-certutil ca  (no set password)

/usr/share/elasticsearch/bin/elasticsearch-certutil cert --ca elastic-stack-ca.p12 (set password: 123456)

user: elastic
password: ednFPXyz357@#

user: kibana_system
password: kibana357xy@

user: logstash_system
password: logstashXyZ235#
root@logstash:/etc/logstash# cat /etc/logstash/logstash.yml |grep -v '^$' | grep -v '^#'
path.data: /var/lib/logstash
path.logs: /var/log/logstash
root@logstash:/etc/logstash#
root@logstash:/etc/logstash# cat /etc/logstash/conf.d/logsatsh-daemonset-jsonfile-kafka-to-es.conf
input {
  kafka {
    bootstrap_servers => "172.16.1.67:9092,172.16.1.37:9092,172.16.1.203:9092"
    topics => ["jsonfile-log-topic"]
    codec => "json"
  }
}

output {
  stdout { codec => rubydebug }
}


output {
  #if [fields][type] == "app1-access-log" {
  if [type] == "jsonfile-daemonset-applog" {
    elasticsearch {
      hosts => ["172.16.20.66:9200","172.16.20.60:9200","172.16.20.105:9200","172.16.100.28:9200"]
      index => "jsonfile-daemonset-applog-%{+YYYY.MM.dd}"
      cacert => '/etc/logstash/elastic-certificates.p12'
      user => "elastic"
      password => "ednFPXyz357@#"
    }}

  if [type] == "jsonfile-daemonset-syslog" {
    elasticsearch {
      hosts => ["http://172.16.20.66:9200","https://172.16.20.60:9200","https://172.16.20.105:9200","https://172.16.100.28:9200"]
      index => "jsonfile-daemonset-syslog-%{+YYYY.MM.dd}"
      cacert => '/etc/logstash/elastic-certificates.p12'
      user => "elastic"
      password => "ednFPXyz357@#"
    }}

}
Here I post the error message of logstash:
root@logstash:/etc/logstash/conf.d# /usr/share/logstash/bin/logstash  -f /etc/logstash/conf.d/logsatsh-daemonset-jsonfile-kafka-to-es.conf --path.settings=/etc/logstash
Using bundled JDK: /usr/share/logstash/jdk
Sending Logstash logs to /var/log/logstash which is now configured via log4j2.properties
[2022-12-24T06:55:35,440][INFO ][logstash.runner          ] Log4j configuration path used is: /etc/logstash/log4j2.properties
[2022-12-24T06:55:35,453][INFO ][logstash.runner          ] Starting Logstash {"logstash.version"=>"8.5.3", "jruby.version"=>"jruby 9.3.9.0 (2.6.8) 2022-10-24 537cd1f8bc OpenJDK 64-Bit Server VM 17.0.5+8 on 17.0.5+8 +indy +jit [x86_64-linux]"}
[2022-12-24T06:55:35,457][INFO ][logstash.runner          ] JVM bootstrap flags: [-Xms1g, -Xmx1g, -Djava.awt.headless=true, -Dfile.encoding=UTF-8, -Djruby.compile.invokedynamic=true, -Djruby.jit.threshold=0, -XX:+HeapDumpOnOutOfMemoryError, -Djava.security.egd=file:/dev/urandom, -Dlog4j2.isThreadContextMapInheritable=true, -Djruby.regexp.interruptible=true, -Djdk.io.File.enableADS=true, --add-exports=jdk.compiler/com.sun.tools.javac.api=ALL-UNNAMED, --add-exports=jdk.compiler/com.sun.tools.javac.file=ALL-UNNAMED, --add-exports=jdk.compiler/com.sun.tools.javac.parser=ALL-UNNAMED, --add-exports=jdk.compiler/com.sun.tools.javac.tree=ALL-UNNAMED, --add-exports=jdk.compiler/com.sun.tools.javac.util=ALL-UNNAMED, --add-opens=java.base/java.security=ALL-UNNAMED, --add-opens=java.base/java.io=ALL-UNNAMED, --add-opens=java.base/java.nio.channels=ALL-UNNAMED, --add-opens=java.base/sun.nio.ch=ALL-UNNAMED, --add-opens=java.management/sun.management=ALL-UNNAMED]
[2022-12-24T06:55:35,981][WARN ][logstash.config.source.multilocal] Ignoring the 'pipelines.yml' file because modules or command line options are specified
[2022-12-24T06:55:38,955][INFO ][logstash.agent           ] Successfully started Logstash API endpoint {:port=>9600, :ssl_enabled=>false}
[2022-12-24T06:55:41,827][INFO ][org.reflections.Reflections] Reflections took 530 ms to scan 1 urls, producing 125 keys and 438 values
[2022-12-24T06:55:43,435][INFO ][logstash.codecs.json     ] ECS compatibility is enabled but `target` option was not specified. This may cause fields to be set at the top-level of the event where they are likely to clash with the Elastic Common Schema. It is recommended to set the `target` option to avoid potential schema conflicts (if your data is ECS compliant or non-conflicting, feel free to ignore this message)
[2022-12-24T06:55:45,186][INFO ][logstash.javapipeline    ] Pipeline `main` is configured with `pipeline.ecs_compatibility: v8` setting. All plugins in this pipeline will default to `ecs_compatibility => v8` unless explicitly configured otherwise.
[2022-12-24T06:55:45,473][INFO ][logstash.outputs.elasticsearch][main] New Elasticsearch output {:class=>"LogStash::Outputs::ElasticSearch", :hosts=>["//172.16.20.66:9200", "//172.16.20.60:9200", "//172.16.20.105:9200", "//172.16.100.28:9200"]}
[2022-12-24T06:55:48,369][INFO ][logstash.outputs.elasticsearch][main] Elasticsearch pool URLs updated {:changes=>{:removed=>[], :added=>[http://elastic:xxxxxx@172.16.20.66:9200/, http://elastic:xxxxxx@172.16.20.60:9200/, http://elastic:xxxxxx@172.16.20.105:9200/, http://elastic:xxxxxx@172.16.100.28:9200/]}}
[2022-12-24T06:55:49,878][INFO ][logstash.outputs.elasticsearch][main] Failed to perform request {:message=>"172.16.20.66:9200 failed to respond", :exception=>Manticore::ClientProtocolException, :cause=>#<Java::OrgApacheHttp::NoHttpResponseException: 172.16.20.66:9200 failed to respond>}
[2022-12-24T06:55:49,900][WARN ][logstash.outputs.elasticsearch][main] Attempted to resurrect connection to dead ES instance, but got an error {:url=>"http://elastic:xxxxxx@172.16.20.66:9200/", :exception=>LogStash::Outputs::ElasticSearch::HttpClient::Pool::HostUnreachableError, :message=>"Elasticsearch Unreachable: [http://172.16.20.66:9200/][Manticore::ClientProtocolException] 172.16.20.66:9200 failed to respond"}
[2022-12-24T06:55:50,061][INFO ][logstash.outputs.elasticsearch][main] Failed to perform request {:message=>"172.16.20.60:9200 failed to respond", :exception=>Manticore::ClientProtocolException, :cause=>#<Java::OrgApacheHttp::NoHttpResponseException: 172.16.20.60:9200 failed to respond>}
[2022-12-24T06:55:50,101][WARN ][logstash.outputs.elasticsearch][main] Attempted to resurrect connection to dead ES instance, but got an error {:url=>"http://elastic:xxxxxx@172.16.20.60:9200/", :exception=>LogStash::Outputs::ElasticSearch::HttpClient::Pool::HostUnreachableError, :message=>"Elasticsearch Unreachable: [http://172.16.20.60:9200/][Manticore::ClientProtocolException] 172.16.20.60:9200 failed to respond"}
[2022-12-24T06:55:50,140][INFO ][logstash.outputs.elasticsearch][main] Failed to perform request {:message=>"172.16.20.105:9200 failed to respond", :exception=>Manticore::ClientProtocolException, :cause=>#<Java::OrgApacheHttp::NoHttpResponseException: 172.16.20.105:9200 failed to respond>}
[2022-12-24T06:55:50,141][WARN ][logstash.outputs.elasticsearch][main] Attempted to resurrect connection to dead ES instance, but got an error {:url=>"http://elastic:xxxxxx@172.16.20.105:9200/", :exception=>LogStash::Outputs::ElasticSearch::HttpClient::Pool::HostUnreachableError, :message=>"Elasticsearch Unreachable: [http://172.16.20.105:9200/][Manticore::ClientProtocolException] 172.16.20.105:9200 failed to respond"}
[2022-12-24T06:55:50,200][INFO ][logstash.outputs.elasticsearch][main] Failed to perform request {:message=>"172.16.100.28:9200 failed to respond", :exception=>Manticore::ClientProtocolException, :cause=>#<Java::OrgApacheHttp::NoHttpResponseException: 172.16.100.28:9200 failed to respond>}
[2022-12-24T06:55:50,202][WARN ][logstash.outputs.elasticsearch][main] Attempted to resurrect connection to dead ES instance, but got an error {:url=>"http://elastic:xxxxxx@172.16.100.28:9200/", :exception=>LogStash::Outputs::ElasticSearch::HttpClient::Pool::HostUnreachableError, :message=>"Elasticsearch Unreachable: [http://172.16.100.28:9200/][Manticore::ClientProtocolException] 172.16.100.28:9200 failed to respond"}
[2022-12-24T06:55:50,623][INFO ][logstash.outputs.elasticsearch][main] Config is not compliant with data streams. `data_stream => auto` resolved to `false`
[2022-12-24T06:55:50,662][WARN ][logstash.outputs.elasticsearch][main] Elasticsearch Output configured with `ecs_compatibility => v8`, which resolved to an UNRELEASED preview of version 8.0.0 of the Elastic Common Schema. Once ECS v8 and an updated release of this plugin are publicly available, you will need to update this plugin to resolve this warning.
[2022-12-24T06:55:50,663][INFO ][logstash.outputs.elasticsearch][main] New Elasticsearch output {:class=>"LogStash::Outputs::ElasticSearch", :hosts=>["http://172.16.20.66:9200", "https://172.16.20.60:9200", "https://172.16.20.105:9200", "https://172.16.100.28:9200"]}
[2022-12-24T06:55:52,512][ERROR][logstash.javapipeline    ][main] Pipeline error {:pipeline_id=>"main", :exception=>#<LogStash::ConfigurationError: Explicit value for 'scheme' was declared, but it is different in one of the URLs given! Please make sure your URLs are inline with explicit values. The URLs have the property set to 'http', but it was also set to 'https' explicitly>, :backtrace=>["/usr/share/logstash/vendor/bundle/jruby/2.6.0/gems/logstash-output-elasticsearch-11.9.3-java/lib/logstash/outputs/elasticsearch/http_client.rb:234:in `calculate_property'", "/usr/share/logstash/vendor/bundle/jruby/2.6.0/gems/logstash-output-elasticsearch-11.9.3-java/lib/logstash/outputs/elasticsearch/http_client.rb:265:in `scheme'", "/usr/share/logstash/vendor/bundle/jruby/2.6.0/gems/logstash-output-elasticsearch-11.9.3-java/lib/logstash/outputs/elasticsearch/http_client.rb:71:in `build_url_template'", "/usr/share/logstash/vendor/bundle/jruby/2.6.0/gems/logstash-output-elasticsearch-11.9.3-java/lib/logstash/outputs/elasticsearch/http_client.rb:61:in `initialize'", "org/jruby/RubyClass.java:911:in `new'", "/usr/share/logstash/vendor/bundle/jruby/2.6.0/gems/logstash-output-elasticsearch-11.9.3-java/lib/logstash/outputs/elasticsearch/http_client_builder.rb:106:in `create_http_client'", "/usr/share/logstash/vendor/bundle/jruby/2.6.0/gems/logstash-output-elasticsearch-11.9.3-java/lib/logstash/outputs/elasticsearch/http_client_builder.rb:102:in `build'", "/usr/share/logstash/vendor/bundle/jruby/2.6.0/gems/logstash-output-elasticsearch-11.9.3-java/lib/logstash/plugin_mixins/elasticsearch/common.rb:39:in `build_client'", "/usr/share/logstash/vendor/bundle/jruby/2.6.0/gems/logstash-output-elasticsearch-11.9.3-java/lib/logstash/outputs/elasticsearch.rb:296:in `register'", "org/logstash/config/ir/compiler/AbstractOutputDelegatorExt.java:68:in `register'", "/usr/share/logstash/logstash-core/lib/logstash/java_pipeline.rb:234:in `block in register_plugins'", "org/jruby/RubyArray.java:1865:in `each'", "/usr/share/logstash/logstash-core/lib/logstash/java_pipeline.rb:233:in `register_plugins'", "/usr/share/logstash/logstash-core/lib/logstash/java_pipeline.rb:600:in `maybe_setup_out_plugins'", "/usr/share/logstash/logstash-core/lib/logstash/java_pipeline.rb:246:in `start_workers'", "/usr/share/logstash/logstash-core/lib/logstash/java_pipeline.rb:191:in `run'", "/usr/share/logstash/logstash-core/lib/logstash/java_pipeline.rb:143:in `block in start'"], "pipeline.sources"=>["/etc/logstash/conf.d/logsatsh-daemonset-jsonfile-kafka-to-es.conf"], :thread=>"#<Thread:0x252b569f run>"}
[2022-12-24T06:55:52,551][INFO ][logstash.javapipeline    ][main] Pipeline terminated {"pipeline.id"=>"main"}
[2022-12-24T06:55:52,610][ERROR][logstash.agent           ] Failed to execute action {:id=>:main, :action_type=>LogStash::ConvergeResult::FailedAction, :message=>"Could not execute action: PipelineAction::Create<main>, action_result: false", :backtrace=>nil}
[2022-12-24T06:55:53,396][INFO ][logstash.runner          ] Logstash shut down.
[2022-12-24T06:55:53,515][FATAL][org.logstash.Logstash    ] Logstash stopped processing because of an error: (SystemExit) exit
org.jruby.exceptions.SystemExit: (SystemExit) exit
	at org.jruby.RubyKernel.exit(org/jruby/RubyKernel.java:790) ~[jruby.jar:?]
	at org.jruby.RubyKernel.exit(org/jruby/RubyKernel.java:753) ~[jruby.jar:?]
	at usr.share.logstash.lib.bootstrap.environment.<main>(/usr/share/logstash/lib/bootstrap/environment.rb:91) ~[?:?]
root@logstash:/etc/logstash/conf.d#
In addition, I noticed the official document link of logstash:
https://www.elastic.co/guide/en/logstash/current/ls-security.html
To tell the truth, this document looks very confusing. ELK is a popular combination, but there is no official document on how to deploy ELK with xpack enabled.

