Hello all, I have a question, if someone know what can be issue, when on Discovery view I get a JSON on each row, insted of separated rows, eg.:
I get this:
? beat { "name": "hostname.domain", "hostname": "hostname.domain", "version": "6.4.3" }
But want to get this, on separate rows:
t beat.name hostname.domain
t beat.hostname hostname.domain
t beat.version 6.4.3
It started to behave like that from unknown reason. I suspect, that this can be related with Logstash upgrade, but unable to find how to allign this all to new version, or maybe better to downgrade this? On some indexes I get a proper split values and for some I get JSON.
If you compare one index that is working correctly and one that isn't, do the mappings and documents look the same?
Are these indices using the same index pattern in Kibana? If not, have you tried refreshing the index pattern's columns? (you can do this under Management > Kibana > Index Patterns, selecting the one you want to refresh and clicking refresh icon in the top right).
Can you provide any screenshots so I have better understanding of what you're seeing?
Comparing diferent index'es all have a good structure of JSON and for all is interpreted correct and for two that I found, bad. Eg. I have two index'es that comes from one pipeline on logstash and get on one splited correct and on second bad...both of them have exactly the same structure of JSON.
No, all use diffrent index pattern. I tried refresch index pattern. Eg.:
Working fine with the same data structure: metrics-es_monitoring-*
I tried to downgrade logstashes from 6.4.3-1 to 6.4.1-1, but this did not help. One wierd thing is, that I have Acceptance ENV that have same data as on PRD and I can see on ACC everything works fine...I have idea to upgrade all ELK Stack to 6.6 version, but first need to test this on ACC. Maybe elier someone figure out whats the issue. On all infra two big actions was performed eliear:
Reinstall all beats - But without Heartbeat, that is also broken, so this trail I think we can decline.
Upgrade Logstash - But I rollback this and this not help.
More details:
I reinstalled all beats a couple days ago, but all beats was reinstalled in the same way as always and did not get any error. Also Heartbeat I did not reinstall and I have error on index related with this beat, so I suppose this is not beats fault.
I restarted all ELK Infra, but not work..
I compered a couple Lostash configs and all have the same structure comparing to this two not working
I can not find any use full informations in logs on KIbana, Logstash or Elasticsearch...
I have suspecius, that this can be related with some BUG on Kibana, but not sure...
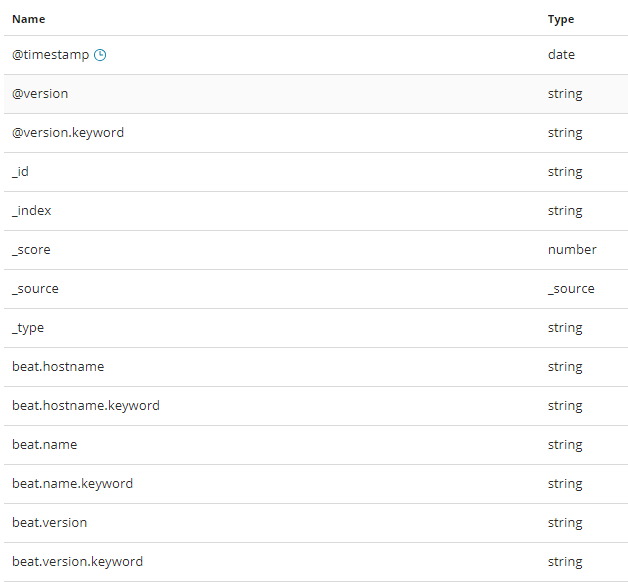
Based on your screenshots, it looks like the "bad" index does not have mappings for the beat.name, beat.hostname, and beat.version fields so Kibana is simply displaying the entire object. (Hint: this is what the little question mark symbol to the left of the fieldname (beat) means in Discover).
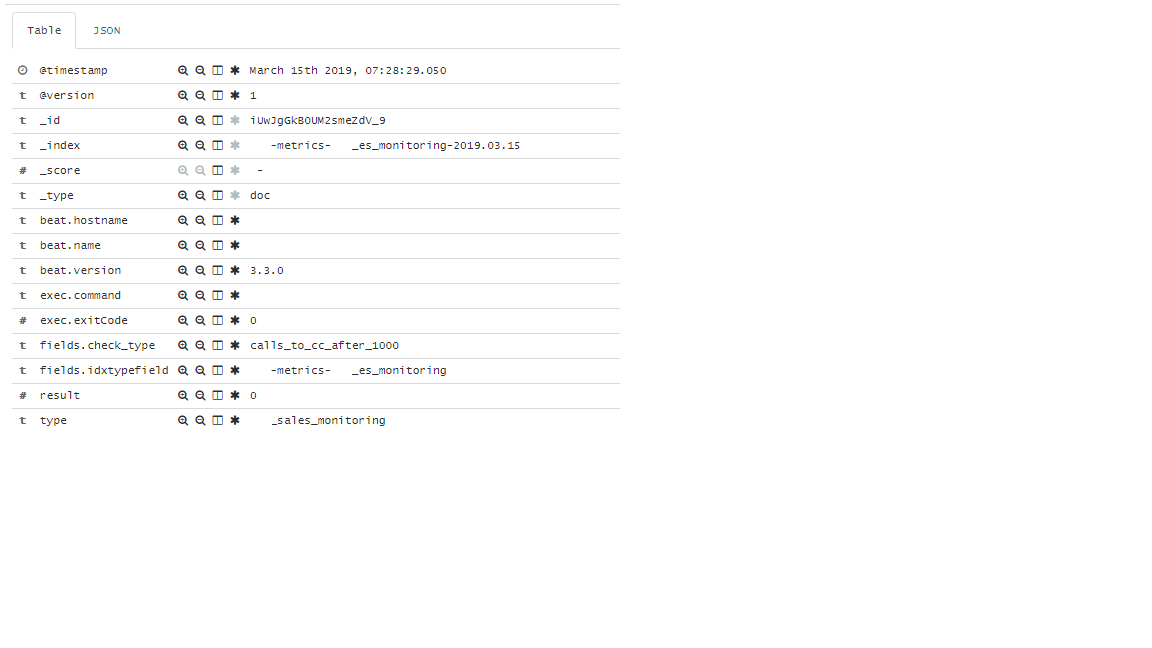
The reason that mapping is missing is because you're running a much older version of execbeat (3.3.0) against a newer version of Elasticsearch, however your other Beats are up to date, which does have that mapping.
We only officially support matching major versions, so I would recommend upgrading that execbeat to 6.4.1 to match your Elasticsearch version which should resolve the issue. Be sure to run execbeat setup after upgrading it to 6.4.1.
Apache, Apache Lucene, Apache Hadoop, Hadoop, HDFS and the yellow elephant
logo are trademarks of the
Apache Software Foundation
in the United States and/or other countries.