ELK-Stack: 7.8
Beats -> Logstash -> ES
in my cluster: I'm ingesting both data logs and monitoring stats to same cluster.
Installed and configured Filebeat 7.8 on a linux server with the below configuration.
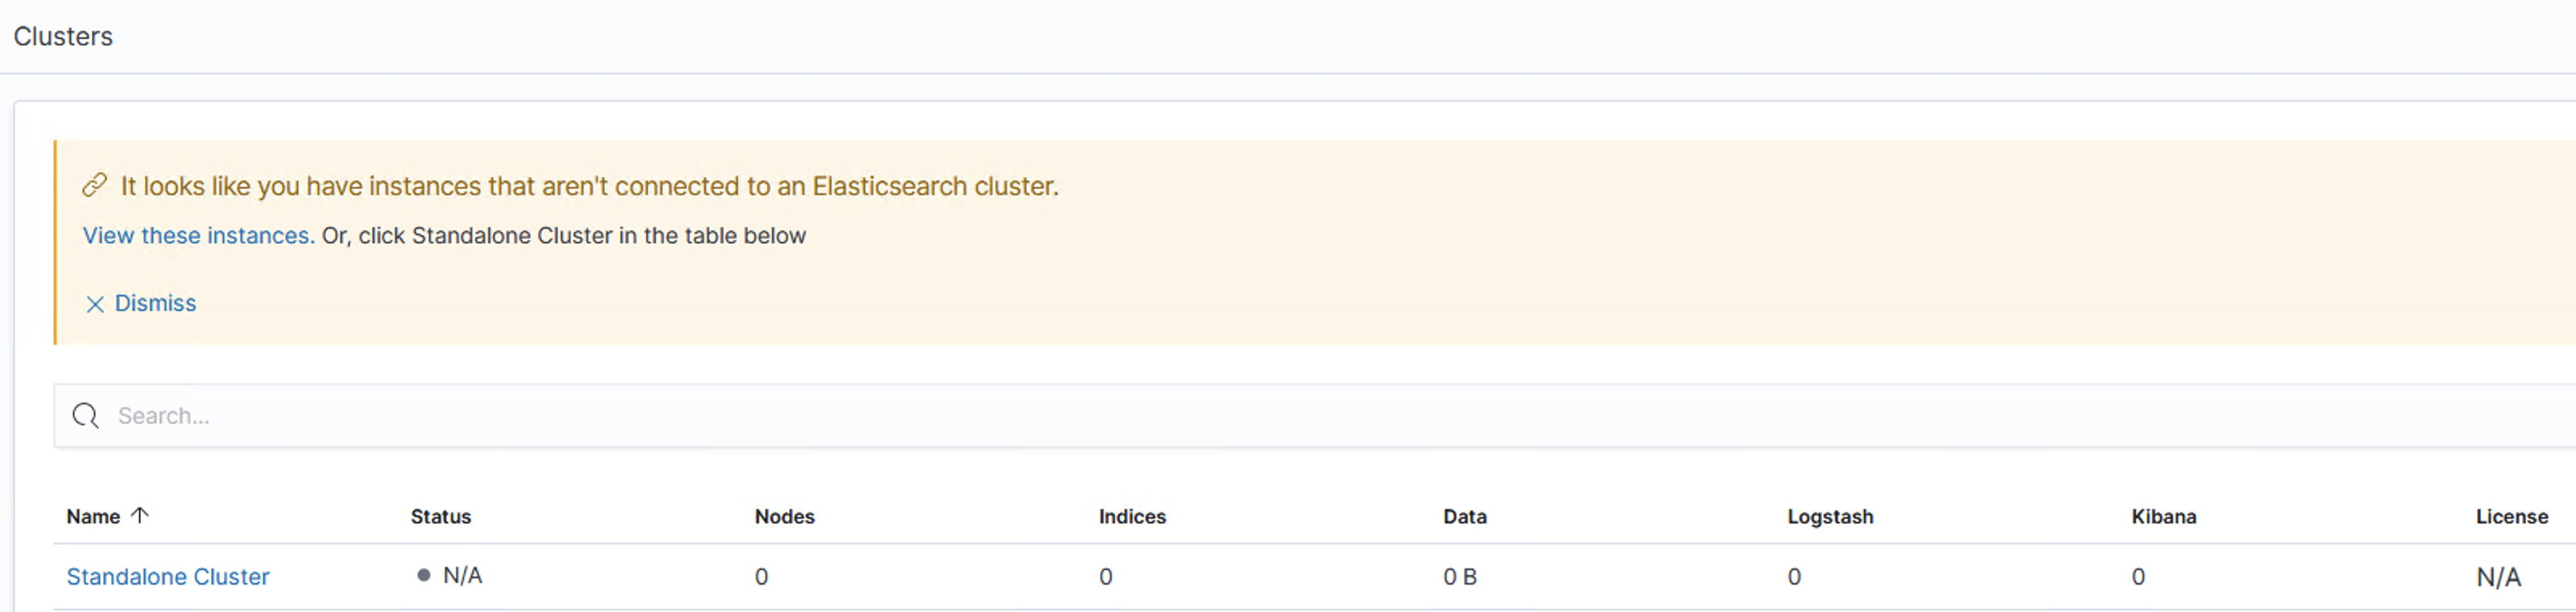
Once started the agent, filebeat-agent is showing/reporting as a new cluster-joinee ("Standalone Cluster) on kibana as below screenshots.
This new installed beats is not being included under our current cluster's beats section rather it's trying to create a new standalone cluster
Please advise

# ============================== Filebeat inputs ===============================
filebeat.inputs:
- type: log
  enabled: false
  paths:
    - /var/log/yum.log

# ============================== Filebeat modules ==============================
filebeat.config.modules:
  path: ${path.config}/modules.d/*.yml
  reload.enabled: false

# ================================= General ===================================
#name:
tags: ["stag"]
fields:
  env: testing

# ================================= Dashboards =================================
setup.dashboards.enabled: true

# =================================== Kibana ===================================
setup.kibana:

  host: "<Kibana-Host:443>"
  username: "elastic"
  password: "${ES_PWD}"
  ssl.enabled: true
  ssl.verification_mode: full
  ssl.certificate_authorities: ["/etc/filebeat/certs/ca.crt"]

# ================================== Outputs ===================================

# ------------------------------ Logstash Output -------------------------------
output.logstash:
  hosts: ["<logstash-host>:5044"]
  ssl.certificate_authorities: ["/etc/filebeat/certs/ca.crt"]
  loadbalance: false
  ssl.verification_mode: full

# ================================== Logging ===================================
name: filebeat
logging.level: info
logging.to_files: true
logging.files:
  path: /etc/filebeat/logs
rotateeverybytes: 26214400
keepfiles: 7
logging.json: true
logging.ecs: true
# ================================== Keystore ==================================
keystore.path: "${path.config}/filebeat.keystore"

# ============================= X-Pack Monitoring ==============================
monitoring.enabled: true

monitoring.elasticsearch:
  hosts: ["<elasticsearch-host>:9200"]
  username: "beats_system"
  password: "${BT_PWD}"
  ssl.certificate_authorities: ["/etc/filebeat/certs/ca.crt"]
  ssl.verification_mode: full