Hello @Sylvain_Juge sorry for delay! I was busy with others tasks, today I restarted it, and I rebuild my stack with the last version (7.16.1) using docker images.
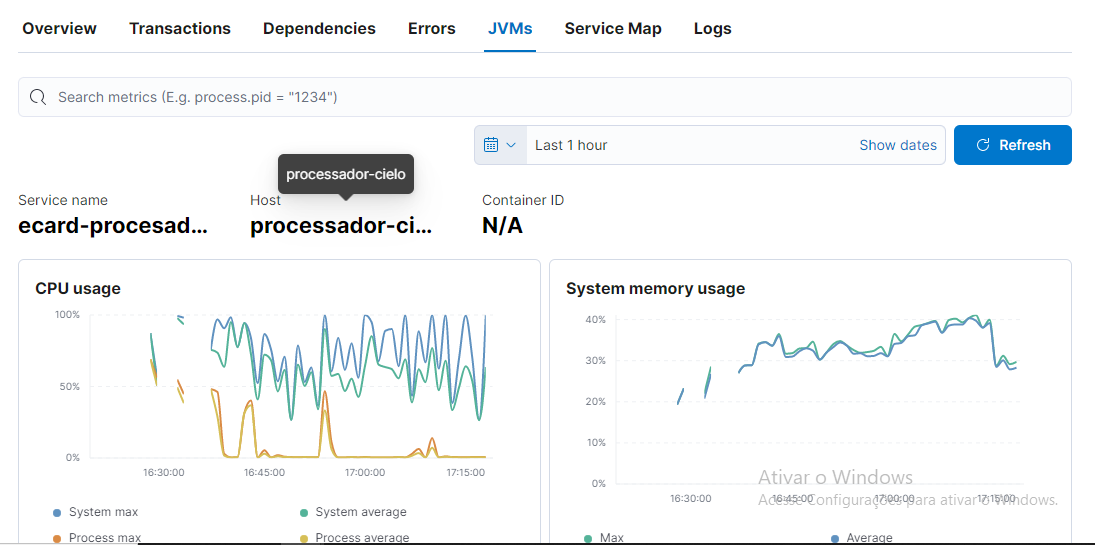
When I start my java standalone apllication processador.jar the services is created, I recive data for JVM usage but don't recive data for traces.
I started my application with agent elastic-apm-agent-1.28.1.jar and put to log, I could see that when the application starts the agent get a exception.
2021-12-17 16:42:36,654 [main] DEBUG co.elastic.apm.agent.util.ExecutorUtils - A new thread named `elastic-apm-configuration-reloader` was created. The original context class loader of this thread (jdk.internal.loader.ClassLoaders$AppClassLoader@2c13da15) has been overridden
2021-12-17 16:42:36,667 [main] TRACE co.elastic.apm.agent.util.ExecutorUtils - Stack trace related to thread creation:
java.lang.Throwable: null
        at co.elastic.apm.agent.util.ExecutorUtils.logThreadCreation(ExecutorUtils.java:99) [elastic-apm-agent-1.28.1.jar:?]
        at co.elastic.apm.agent.util.ExecutorUtils$SingleNamedThreadFactory.newThread(ExecutorUtils.java:88) [elastic-apm-agent-1.28.1.jar:?]
        at java.util.concurrent.ThreadPoolExecutor$Worker.<init>(ThreadPoolExecutor.java:623) [?:?]
        at java.util.concurrent.ThreadPoolExecutor.addWorker(ThreadPoolExecutor.java:912) [?:?]
        at java.util.concurrent.ThreadPoolExecutor.ensurePrestart(ThreadPoolExecutor.java:1583) [?:?]
        at java.util.concurrent.ScheduledThreadPoolExecutor.delayedExecute(ScheduledThreadPoolExecutor.java:346) [?:?]
        at java.util.concurrent.ScheduledThreadPoolExecutor.scheduleAtFixedRate(ScheduledThreadPoolExecutor.java:632) [?:?]
        at co.elastic.apm.agent.impl.ElasticApmTracerBuilder.scheduleReloadAtRate(ElasticApmTracerBuilder.java:180) [elastic-apm-agent-1.28.1.jar:?]
        at co.elastic.apm.agent.impl.ElasticApmTracerBuilder.build(ElasticApmTracerBuilder.java:143) [elastic-apm-agent-1.28.1.jar:?]
        at co.elastic.apm.agent.impl.ElasticApmTracerBuilder.build(ElasticApmTracerBuilder.java:123) [elastic-apm-agent-1.28.1.jar:?]
        at co.elastic.apm.agent.bci.ElasticApmAgent.initialize(ElasticApmAgent.java:145) [elastic-apm-agent-1.28.1.jar:?]
        at jdk.internal.reflect.NativeMethodAccessorImpl.invoke0(Native Method) ~[?:?]
        at jdk.internal.reflect.NativeMethodAccessorImpl.invoke(NativeMethodAccessorImpl.java:62) ~[?:?]
        at jdk.internal.reflect.DelegatingMethodAccessorImpl.invoke(DelegatingMethodAccessorImpl.java:43) ~[?:?]
        at java.lang.reflect.Method.invoke(Method.java:566) ~[?:?]
        at co.elastic.apm.agent.premain.AgentMain.loadAndInitializeAgent(AgentMain.java:149) [elastic-apm-agent-1.28.1.jar:1.28.1]
        at co.elastic.apm.agent.premain.AgentMain.init(AgentMain.java:93) [elastic-apm-agent-1.28.1.jar:1.28.1]
        at co.elastic.apm.agent.premain.AgentMain.premain(AgentMain.java:49) [elastic-apm-agent-1.28.1.jar:1.28.1]
        at jdk.internal.reflect.NativeMethodAccessorImpl.invoke0(Native Method) ~[?:?]
        at jdk.internal.reflect.NativeMethodAccessorImpl.invoke(NativeMethodAccessorImpl.java:62) ~[?:?]
        at jdk.internal.reflect.DelegatingMethodAccessorImpl.invoke(DelegatingMethodAccessorImpl.java:43) ~[?:?]
        at java.lang.reflect.Method.invoke(Method.java:566) ~[?:?]
        at sun.instrument.InstrumentationImpl.loadClassAndStartAgent(InstrumentationImpl.java:513) [?:?]
        at sun.instrument.InstrumentationImpl.loadClassAndCallPremain(InstrumentationImpl.java:525) [?:?]
2021-12-17 16:42:36,817 [main] DEBUG co.elastic.apm.agent.util.ExecutorUtils - A new thread named `elastic-apm-metadata-0` was created. The original context class loader of this thread (jdk.internal.loader.ClassLoaders$AppClassLoader@2c13da15) has been overridden
This exception performs a lot of times and after the agent estabilish send data
{"metricset":{"timestamp":1639772522633000,"samples":{"system.process.cpu.total.norm.pct":{"value":0.002504382669671926},"jvm.memory.heap.used":{"value":355583792.0},"jvm.memory.non_heap.used":{"value":256823848.0},"jvm.memory.heap.max":{"value":7834959872.0},"jvm.gc.alloc":{"value":3162691952.0},"jvm.memory.non_heap.committed":{"value":262021120.0},"system.cpu.total.norm.pct":{"value":0.2706402871692128},"system.process.cgroup.memory.mem.usage.bytes":{"value":8411471872.0},"system.process.memory.size":{"value":12187881472.0},"jvm.memory.heap.committed":{"value":1264582656.0},"jvm.memory.non_heap.max":{"value":-1.0},"system.memory.actual.free":{"value":22912049152.0},"system.memory.total":{"value":31331909632.0},"jvm.thread.count":{"value":74.0}}}}
{"metricset":{"timestamp":1639772522635000,"tags":{"name":"G1 Old Gen"},"samples":{"jvm.memory.heap.pool.committed":{"value":1073741824.0},"jvm.memory.heap.pool.max":{"value":7834959872.0},"jvm.memory.heap.pool.used":{"value":192005936.0}}}}
{"metricset":{"timestamp":1639772522635000,"tags":{"name":"G1 Young Generation"},"samples":{"jvm.gc.time":{"value":2082.0},"jvm.gc.count":{"value":29.0}}}}
{"metricset":{"timestamp":1639772522635000,"tags":{"name":"G1 Old Generation"},"samples":{"jvm.gc.time":{"value":0.0},"jvm.gc.count":{"value":0.0}}}}
{"metricset":{"timestamp":1639772522635000,"tags":{"name":"G1 Eden Space"},"samples":{"jvm.memory.heap.pool.committed":{"value":179306496.0},"jvm.memory.heap.pool.max":{"value":-1.0},"jvm.memory.heap.pool.used":{"value":152043520.0}}}}
{"metricset":{"timestamp":1639772522635000,"tags":{"name":"G1 Survivor Space"},"samples":{"jvm.memory.heap.pool.committed":{"value":11534336.0},"jvm.memory.heap.pool.max":{"value":-1.0},"jvm.memory.heap.pool.used":{"value":11534336.0}}}}

2021-12-17 17:22:12,653 [elastic-apm-server-reporter] DEBUG co.elastic.apm.agent.report.IntakeV2ReportingEventHandler - Flushing 2192 uncompressed 758 compressed bytes
2021-12-17 17:22:12,734 [elastic-apm-circuit-breaker] TRACE co.elastic.apm.agent.impl.circuitbreaker.CircuitBreaker - Scheduling next stress monitor polling in 5000s
2021-12-17 17:22:17,734 [elastic-apm-circuit-breaker] TRACE co.elastic.apm.agent.impl.circuitbreaker.CircuitBreaker - Scheduling next stress monitor polling in 5000s
2021-12-17 17:22:22,735 [elastic-apm-circuit-breaker] TRACE co.elastic.apm.agent.impl.circuitbreaker.CircuitBreaker - Scheduling next stress monitor polling in 5000s
2021-12-17 17:22:27,735 [elastic-apm-circuit-breaker] TRACE co.elastic.apm.agent.impl.circuitbreaker.CircuitBreaker - Scheduling next stress monitor polling in 5000s
2021-12-17 17:22:28,019 [elastic-apm-configuration-reloader] DEBUG co.elastic.apm.agent.impl.ElasticApmTracerBuilder - Beginning scheduled configuration reload (interval is 30 sec)...
Really I don't know how to solve it, and I can't to find a solution on the forum, I tryed to execute my application with java 8 and 11, and I get the same problem.
If you could help me I will be greatfull