BitSet.or consumes almost 60% cpu

ES 7.7.1, jdk 14.
We have two nodes with the same hardware(physical machine) under the same cluster which only hosts one index with 1 replica. Each node has the same shard.

The weird thing is that, one of the machine's CPU is very high, sometimes is running at full capacity while the other only uses 5%. Though they are handling the same queries.

Here are the flame graphs. We find that the BitSet.or method consumes almost 60% cpu.
What went wrong?

2 Likes

Do you have thousands of search terms in a terms query?
The section of code you're looking at is where terms query asks each term to load the full list of documents that contain that term and set a 1 in the bitset that is the union of all the terms.

The queries are about 30 terms avg.
I know the difference when the threshold exceeds 16.
My question is why they behaved differently? Why one node consumes so much cpu?

How many clients hit the cluster? Are they all favouring the same replica if it is a single shard?
The "routing preference" parameter helps keep clients go back to the same replica where caches are likely to be warmed for their searches and the routing key normally used is a session ID. Kibana uses this.

Yes, we have checked out the load balance, they are taking the same traffic.
Though clients are using the preference=_local, clients' routing algo is round-robin.

Here is the node status link.

The left one is the healthy node.

Regardless of the traffic, we profiled a single query against two nodes result in the same situation.
Here is the query,

POST myindex/_search
{
  "_source": false,
  "profile":true,
  "docvalue_fields": [
    "v_spu_id",
    "brand_store_sn",
    "goods_cate_id_1",
    "goods_cate_id_2",
    "goods_cate_id_3",
    "product_tags_pdc",
    "product_tags_ptp",
    "product_tags_vde",
    "product_tags_usual_ptp",
    "spu_vip_self",
    "goods_inner_cate_id_3"
  ],
  "stored_fields": "_none_",
  "from": 0,
  "size": 270,
  "track_total_hits": true,
  "query": {
    "function_score": {
      "query": {
        "bool": {
          "filter": [
            {
              "bool": {
                "should": [
                  {
                    "bool": {
                      "must": [
                        {
                          "terms": {
                            "product_props": [
                             
                              "学前儿童_V",
                              "幼儿_V",
                              "男女童_V",
                              "儿童_V",
                              "学龄前儿童_V",
                              "中童_V",
                              "低龄儿童_V",
                              "学童_V",
                              "大童_V",
                              "小男童_V",
                              "女童_V",
                              "婴童_V",
                              "中大童_V",
                              "早期儿童_V",
                              "小童_V"
                            ]
                          }
                        },
                        {
                          "terms": {
                            "product_props": [
                              "贵妇_V",
                              "中年妇女_V",
                              "轻熟女_V",
                              "女宝宝_V",
                              "少女_V",
                              "母女_V",
                              "闺女_V",
                              "淑女_V",
                              "年青人女性_V",
                              "仙女_V",
                              "女友_V",
                              "女王_V",
                              "女_V",
                              "年青人女士_V",
                              "仕女_V",
                              "女童_V",
                              "年青人女子_V",
                              "熟女_V",
                              "年青人女人_V",
                              "ol_V",
                              "少妇_V",
                              "家庭主妇_V"
                            ]
                          }
                        },
                        {
                          "terms": {
                            "product_all": [
                              "A_帆布鞋_V",
                              "A_雪地鞋_V",
                              "A_工装靴_V",
                              "A_旱冰鞋_V",
                              "A_冰刀鞋_V",
                              "A_皮靴_V",
                              "A_篮球鞋_V",
                              "A_鞋_V",
                              "A_羽毛球鞋_V",
                              "A_皮鞋_V",
                              "A_小白鞋_V",
                              "A_网球鞋_V",
                              "A_运动鞋_V",
                              "A_旗鞋_V",
                              "A_乐福鞋_V",
                              "A_饼干鞋_V",
                              "A_舞蹈鞋_V",
                              "A_马靴_V",
                              "A_棉拖_V",
                              "A_玛丽珍鞋_V",
                              "A_棒球鞋_V",
                              "A_解放鞋_V",
                              "A_越野鞋_V",
                              "A_一脚蹬_V",
                              "A_便鞋_V",
                              "A_乒乓球鞋_V",
                              "A_凉拖_V",
                              "A_短靴_V",
                              "A_人字拖_V",
                              "A_徒步鞋_V",
                              "A_正装鞋_V",
                              "A_硫化鞋_V",
                              "A_秋鞋_V",
                              "A_钉鞋_V",
                              "A_阿甘鞋_V",
                              "A_雨鞋_V",
                              "A_猫爪鞋_V",
                              "A_马丁靴_V",
                              "A_军靴_V",
                              "A_单靴_V",
                              "A_切尔西靴_V",
                              "A_溯溪鞋_V",
                              "A_登山鞋_V",
                              "A_舞鞋_V",
                              "A_松糕鞋_V",
                              "A_蛙鞋_V",
                              "A_小黑鞋_V",
                              "A_胶鞋_V",
                              "A_罗马鞋_V",
                              "A_长靴_V",
                              "A_袜靴_V",
                              "A_网鞋_V",
                              "A_水靴_V",
                              "A_健步鞋_V",
                              "A_战靴_V",
                              "A_滑板鞋_V",
                              "A_冰鞋_V",
                              "A_僧侣鞋_V",
                              "A_冰球鞋_V",
                              "A_军鞋_V",
                              "A_德比鞋_V",
                              "A_马丁鞋_V",
                              "A_单鞋_V",
                              "A_洛克鞋_V",
                              "A_板鞋_V",
                              "A_布鞋_V",
                              "A_波鞋_V",
                              "A_球鞋_V",
                              "A_瓢鞋_V",
                              "A_凉鞋_V",
                              "A_保暖鞋_V",
                              "A_豆豆鞋_V",
                              "A_洞沿鞋_V",
                              "A_棉鞋_V",
                              "A_雪地靴_V",
                              "A_灯鞋_V",
                              "A_熊猫鞋_V",
                              "A_草鞋_V",
                              "A_气垫鞋_V",
                              "A_靴_V",
                              "A_跑步鞋_V",
                              "A_勃肯鞋_V",
                              "A_拖鞋_V",
                              "A_足球鞋_V",
                              "A_婚鞋_V",
                              "A_渔夫鞋_V",
                              "A_椰子鞋_V",
                              "A_跳跃鞋_V",
                              "A_排球鞋_V",
                              "A_袜鞋_V"
                            ]
                          }
                        },
                        {
                          "match_all": {}
                        }
                      ]
                    }
                  }
                ]
              }
            }
          ]
        }
      },
      "functions": [
        {
          "field_value_factor": {
            "field": "static_score_9",
            "factor": 1,
            "missing": 1
          }
        }
      ],
      "score_mode": "first",
      "boost_mode": "replace"
    }
  }
}

Pls click the link to check out the output.
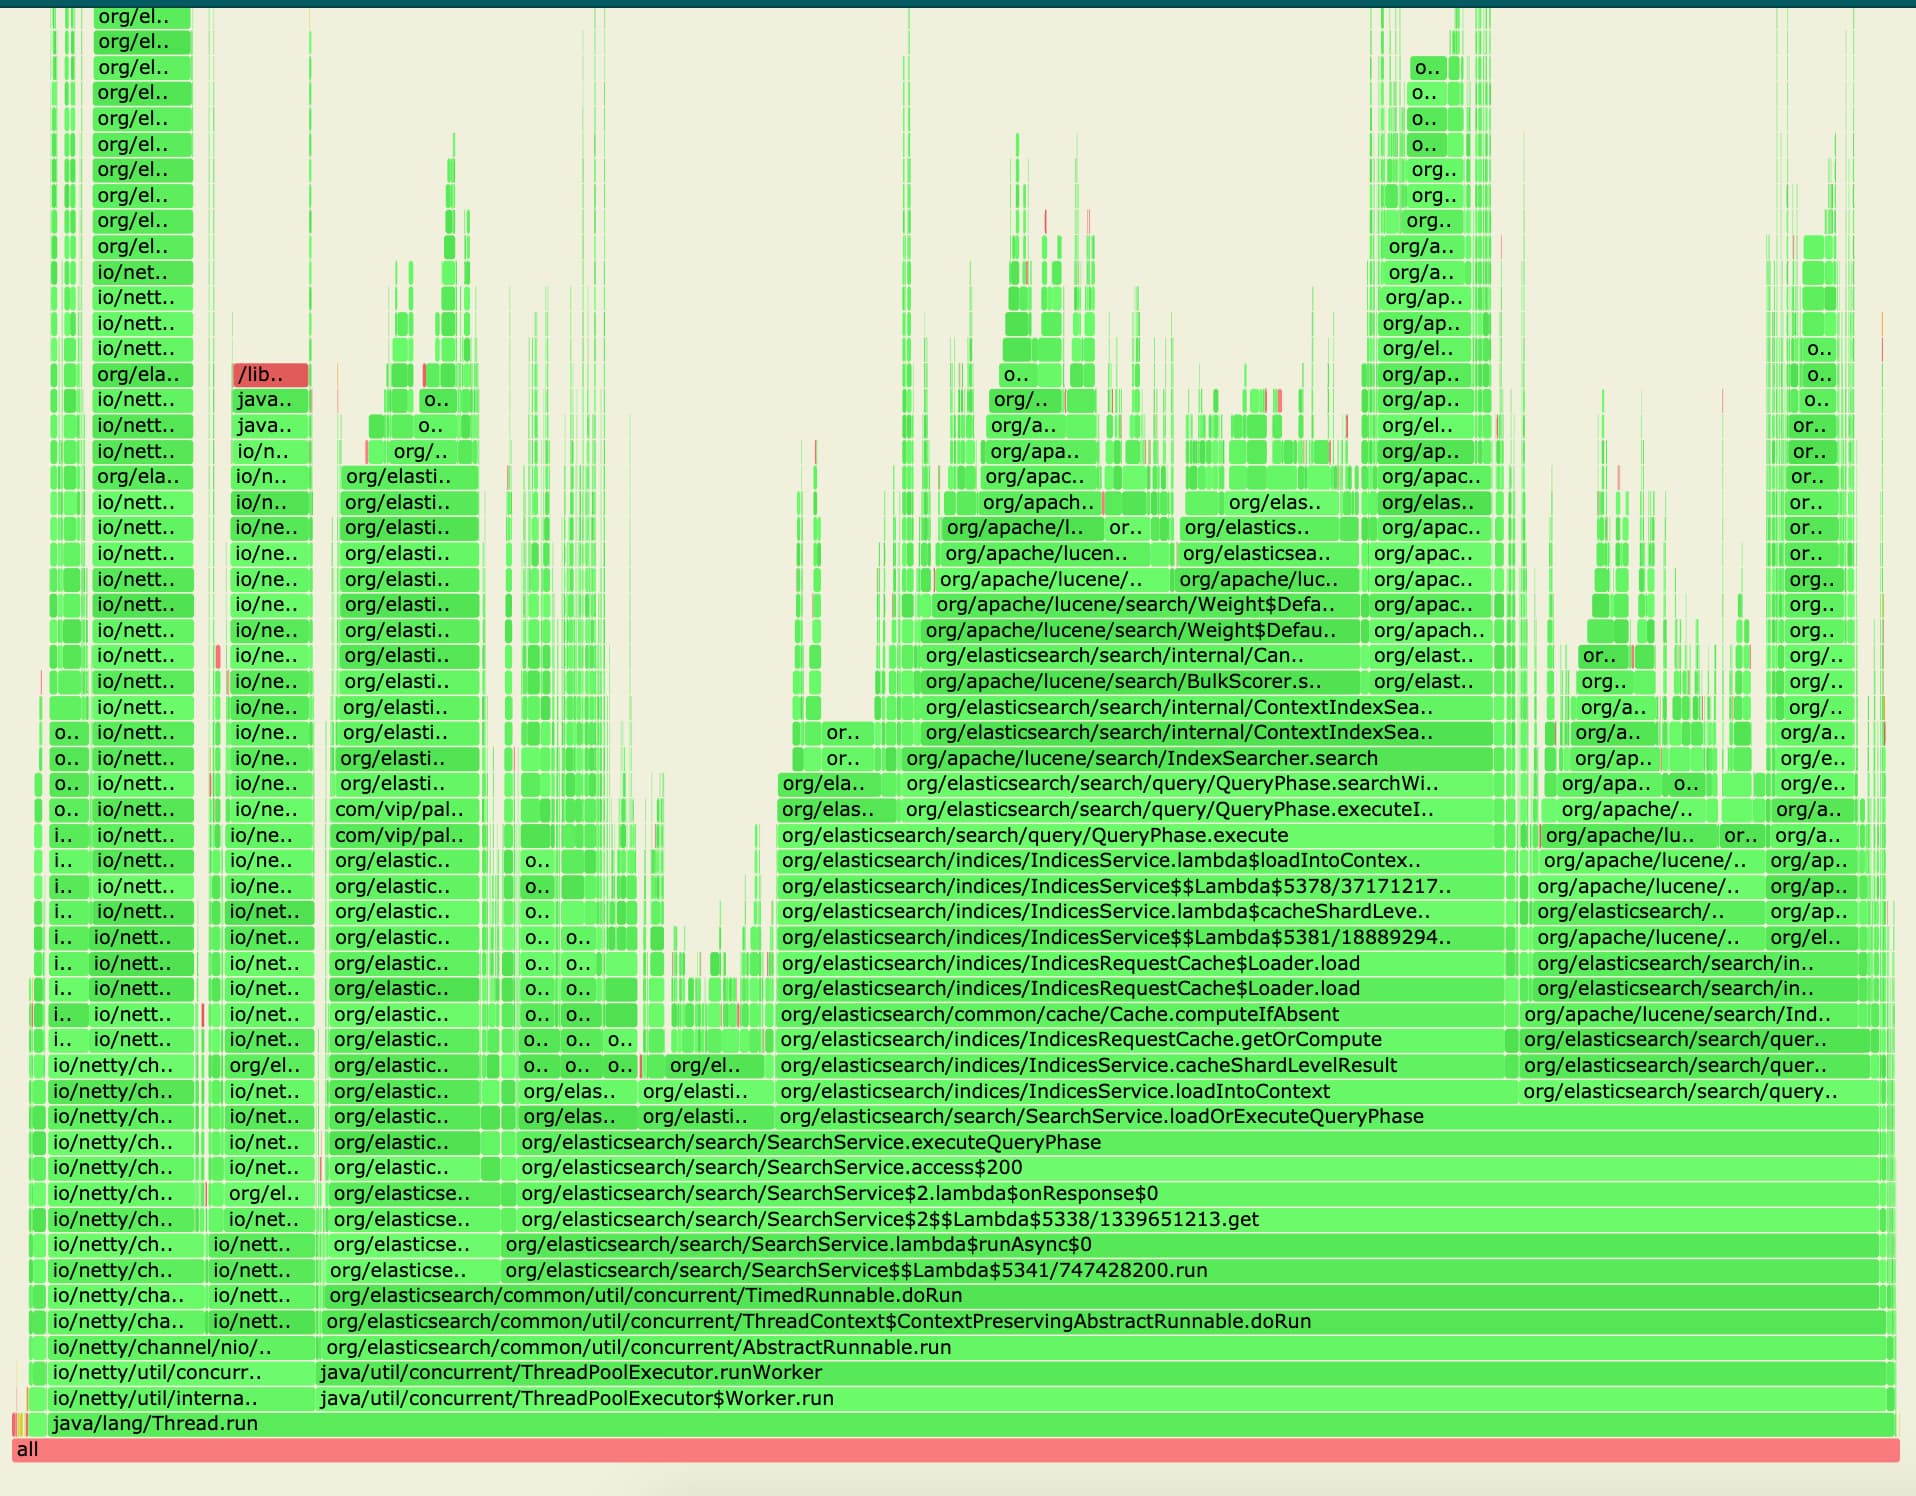
profile result, the right one is the healthy one

As we can see from the link, the left one's TermInSetQuery are taking much much more time than the right one. It looks like the problematic node is broken inside and can't go back to normal any more.

1 Like

That's quite a difference.

We have two nodes with the same hardware(physical machine)

Do you mean same hardware make/model/spec or actually 2 nodes running on the same machine?
Is there a difference in segments e.g. numbers of deletes or segments in general?
If you force merge is there a difference? (force merge is very expensive so don't do it if in a production environment and not sure about what's involved).

I mean two servers, they got the same cpu/mem/ssd and so on.

Each one runs an es instance.

The shard has been forced-merge into one segment before taken the traffic.

What else info do you need

That is unusual.
Same software.
Same query.
Same content.
Same matching doc count.
Same number of segments (did you check after force -merge how many segments remain to confirm it is 1?).

File system cache may be a part to this. What are the timings given a cold start?

did you check after force -merge how many segments remain to confirm it is 1?

The number of segment is 1.
We have compared the status of the two shards, there is no big difference.

File system cache may be a part to this.

No swap is used, JVM's xmx is set to 31G, leave 160G to the system.

What are the timings given a cold start?

Both nodes and the index has been running in the production for a while(some weeks). Three days ago, one of the node's cpu went high.
This is a static index, which means there are no insertions or deletions.

The problematic node is still running in the production. Our SA won't restart it until we find out what went wrong.

This problem has tortured us for three days. Pls save us :joy:

Can you share hot threads output while under load?

Here it is.
It's very similar to the flame graph we saw.

::: {node-with-problems}{TsilJkYMQF2CADFG480}{1yp7YwTrQUGPlNNlyi_XEQ}{101.101.106.23}{101.101.106.23:9300}{dir}{xpack.installed=true, transform.node=false}
   Hot threads at 2021-10-14T02:45:32.551Z, interval=500ms, busiestThreads=3, ignoreIdleThreads=true:
   
   26.7% (133.5ms out of 500ms) cpu usage by thread 'elasticsearch[node-with-problems][search][T#135]'
     3/10 snapshots sharing following 43 elements
       app//org.apache.lucene.util.BitSet.or(BitSet.java:96)
       app//org.apache.lucene.util.FixedBitSet.or(FixedBitSet.java:271)
       app//org.apache.lucene.util.DocIdSetBuilder.add(DocIdSetBuilder.java:151)
       app//org.apache.lucene.search.TermInSetQuery$1.rewrite(TermInSetQuery.java:273)
       app//org.apache.lucene.search.TermInSetQuery$1.scorer(TermInSetQuery.java:336)
       app//org.apache.lucene.search.Weight.scorerSupplier(Weight.java:147)
       app//org.apache.lucene.search.LRUQueryCache$CachingWrapperWeight.scorerSupplier(LRUQueryCache.java:721)
       app//org.elasticsearch.indices.IndicesQueryCache$CachingWeightWrapper.scorerSupplier(IndicesQueryCache.java:157)
       app//org.apache.lucene.search.BooleanWeight.scorerSupplier(BooleanWeight.java:379)
       app//org.apache.lucene.search.BooleanWeight.scorer(BooleanWeight.java:344)
       app//org.elasticsearch.common.lucene.search.function.FunctionScoreQuery$CustomBoostFactorWeight.functionScorer(FunctionScoreQuery.java:268)
       app//org.elasticsearch.common.lucene.search.function.FunctionScoreQuery$CustomBoostFactorWeight.scorer(FunctionScoreQuery.java:291)
       app//org.apache.lucene.search.Weight.scorerSupplier(Weight.java:147)
       app//org.apache.lucene.search.BooleanWeight.scorerSupplier(BooleanWeight.java:379)
       app//org.apache.lucene.search.BooleanWeight.scorer(BooleanWeight.java:344)
       app//org.apache.lucene.search.Weight.bulkScorer(Weight.java:181)
       app//org.apache.lucene.search.BooleanWeight.bulkScorer(BooleanWeight.java:338)
       app//org.elasticsearch.search.internal.ContextIndexSearcher$1.bulkScorer(ContextIndexSearcher.java:258)
       app//org.elasticsearch.search.internal.ContextIndexSearcher.searchLeaf(ContextIndexSearcher.java:209)
       app//org.elasticsearch.search.internal.ContextIndexSearcher.search(ContextIndexSearcher.java:185)
       app//org.apache.lucene.search.IndexSearcher.search(IndexSearcher.java:445)
       app//org.elasticsearch.search.query.QueryPhase.searchWithCollector(QueryPhase.java:344)
       app//org.elasticsearch.search.query.QueryPhase.executeInternal(QueryPhase.java:299)
       app//org.elasticsearch.search.query.QueryPhase.execute(QueryPhase.java:151)
       app//org.elasticsearch.search.SearchService.loadOrExecuteQueryPhase(SearchService.java:361)
       app//org.elasticsearch.search.SearchService.executeQueryPhase(SearchService.java:434)
       app//org.elasticsearch.search.SearchService.access$200(SearchService.java:135)
       app//org.elasticsearch.search.SearchService$2.lambda$onResponse$0(SearchService.java:395)
       app//org.elasticsearch.search.SearchService$2$$Lambda$5540/0x0000000801e6d840.get(Unknown Source)
       app//org.elasticsearch.search.SearchService.lambda$runAsync$0(SearchService.java:411)
       app//org.elasticsearch.search.SearchService$$Lambda$5541/0x0000000801e6dc40.run(Unknown Source)
       app//org.elasticsearch.common.util.concurrent.TimedRunnable.doRun(TimedRunnable.java:44)
       app//org.elasticsearch.common.util.concurrent.ThreadContext$ContextPreservingAbstractRunnable.doRun(ThreadContext.java:692)
       app//org.elasticsearch.common.util.concurrent.AbstractRunnable.run(AbstractRunnable.java:37)
       java.base@14.0.1/java.util.concurrent.ThreadPoolExecutor.runWorker(ThreadPoolExecutor.java:1130)
       java.base@14.0.1/java.util.concurrent.ThreadPoolExecutor$Worker.run(ThreadPoolExecutor.java:630)
       java.base@14.0.1/java.lang.Thread.run(Thread.java:832)
     2/10 snapshots sharing following 43 elements
       app//org.apache.lucene.util.BitSet.or(BitSet.java:95)
       app//org.apache.lucene.util.FixedBitSet.or(FixedBitSet.java:271)
       app//org.apache.lucene.util.DocIdSetBuilder.add(DocIdSetBuilder.java:151)
       app//org.apache.lucene.search.TermInSetQuery$1.rewrite(TermInSetQuery.java:273)
       app//org.apache.lucene.search.TermInSetQuery$1.scorer(TermInSetQuery.java:336)
       app//org.apache.lucene.search.Weight.scorerSupplier(Weight.java:147)
       app//org.apache.lucene.search.LRUQueryCache$CachingWrapperWeight.scorerSupplier(LRUQueryCache.java:721)
       app//org.elasticsearch.indices.IndicesQueryCache$CachingWeightWrapper.scorerSupplier(IndicesQueryCache.java:157)
       app//org.apache.lucene.search.BooleanWeight.scorerSupplier(BooleanWeight.java:379)
       app//org.apache.lucene.search.LRUQueryCache$CachingWrapperWeight.scorerSupplier(LRUQueryCache.java:721)
       app//org.elasticsearch.indices.IndicesQueryCache$CachingWeightWrapper.scorerSupplier(IndicesQueryCache.java:157)
       app//org.apache.lucene.search.BooleanWeight.scorerSupplier(BooleanWeight.java:379)
       app//org.apache.lucene.search.LRUQueryCache$CachingWrapperWeight.scorerSupplier(LRUQueryCache.java:721)
       app//org.elasticsearch.indices.IndicesQueryCache$CachingWeightWrapper.scorerSupplier(IndicesQueryCache.java:157)
       app//org.apache.lucene.search.BooleanWeight.scorerSupplier(BooleanWeight.java:379)
       app//org.apache.lucene.search.BooleanWeight.scorer(BooleanWeight.java:344)
       app//org.elasticsearch.common.lucene.search.function.FunctionScoreQuery$CustomBoostFactorWeight.functionScorer(FunctionScoreQuery.java:268)
       app//org.elasticsearch.common.lucene.search.function.FunctionScoreQuery$CustomBoostFactorWeight.scorer(FunctionScoreQuery.java:291)
       app//org.apache.lucene.search.Weight.scorerSupplier(Weight.java:147)
       app//org.apache.lucene.search.BooleanWeight.scorerSupplier(BooleanWeight.java:379)
       app//org.apache.lucene.search.BooleanWeight.scorer(BooleanWeight.java:344)
       app//org.apache.lucene.search.Weight.bulkScorer(Weight.java:181)
       app//org.apache.lucene.search.BooleanWeight.bulkScorer(BooleanWeight.java:338)
       app//org.elasticsearch.search.internal.ContextIndexSearcher$1.bulkScorer(ContextIndexSearcher.java:258)
       app//org.elasticsearch.search.internal.ContextIndexSearcher.searchLeaf(ContextIndexSearcher.java:209)
       app//org.elasticsearch.search.internal.ContextIndexSearcher.search(ContextIndexSearcher.java:185)
       app//org.apache.lucene.search.IndexSearcher.search(IndexSearcher.java:445)
       app//org.elasticsearch.search.query.QueryPhase.searchWithCollector(QueryPhase.java:344)
       app//org.elasticsearch.search.query.QueryPhase.executeInternal(QueryPhase.java:299)
       app//org.elasticsearch.search.query.QueryPhase.execute(QueryPhase.java:151)
       app//org.elasticsearch.search.SearchService.loadOrExecuteQueryPhase(SearchService.java:361)
       app//org.elasticsearch.search.SearchService.executeQueryPhase(SearchService.java:434)
       app//org.elasticsearch.search.SearchService.access$200(SearchService.java:135)
       app//org.elasticsearch.search.SearchService$2.lambda$onResponse$0(SearchService.java:395)
       app//org.elasticsearch.search.SearchService$2$$Lambda$5540/0x0000000801e6d840.get(Unknown Source)
       app//org.elasticsearch.search.SearchService.lambda$runAsync$0(SearchService.java:411)
       app//org.elasticsearch.search.SearchService$$Lambda$5541/0x0000000801e6dc40.run(Unknown Source)
       app//org.elasticsearch.common.util.concurrent.TimedRunnable.doRun(TimedRunnable.java:44)
       app//org.elasticsearch.common.util.concurrent.ThreadContext$ContextPreservingAbstractRunnable.doRun(ThreadContext.java:692)
       app//org.elasticsearch.common.util.concurrent.AbstractRunnable.run(AbstractRunnable.java:37)
       java.base@14.0.1/java.util.concurrent.ThreadPoolExecutor.runWorker(ThreadPoolExecutor.java:1130)
       java.base@14.0.1/java.util.concurrent.ThreadPoolExecutor$Worker.run(ThreadPoolExecutor.java:630)
       java.base@14.0.1/java.lang.Thread.run(Thread.java:832)
     5/10 snapshots sharing following 2 elements
       java.base@14.0.1/java.util.concurrent.ThreadPoolExecutor$Worker.run(ThreadPoolExecutor.java:630)
       java.base@14.0.1/java.lang.Thread.run(Thread.java:832)
   
   24.9% (124.2ms out of 500ms) cpu usage by thread 'elasticsearch[node-with-problems][search][T#218]'
     10/10 snapshots sharing following 2 elements
       java.base@14.0.1/java.util.concurrent.ThreadPoolExecutor$Worker.run(ThreadPoolExecutor.java:630)
       java.base@14.0.1/java.lang.Thread.run(Thread.java:832)


Thanks. And for comparison can we have a hot threads from the healthy server while servicing similar searches?

::: {healthy_node}{Wa48OwSKSHG0_g8wOW3}{II_eBVVWRI6-EubxrZth}{101.101.101.24}{101.101.101.24:9300}{dir}{xpack.installed=true, transform.node=false}
   Hot threads at 2021-10-18T15:48:41.480Z, interval=500ms, busiestThreads=3, ignoreIdleThreads=true:
   
    8.0% (39.7ms out of 500ms) cpu usage by thread 'elasticsearch[healthy_node][search][T#213]'
     2/10 snapshots sharing following 23 elements
       app//org.elasticsearch.indices.IndicesService.lambda$loadIntoContext$21(IndicesService.java:1344)
       app//org.elasticsearch.indices.IndicesService$$Lambda$5378/0x0000000801e51440.accept(Unknown Source)
       app//org.elasticsearch.indices.IndicesService.lambda$cacheShardLevelResult$22(IndicesService.java:1396)
       app//org.elasticsearch.indices.IndicesService$$Lambda$5381/0x0000000801e52040.get(Unknown Source)
       app//org.elasticsearch.indices.IndicesRequestCache$Loader.load(IndicesRequestCache.java:176)
       app//org.elasticsearch.indices.IndicesRequestCache$Loader.load(IndicesRequestCache.java:159)
       app//org.elasticsearch.common.cache.Cache.computeIfAbsent(Cache.java:433)
       app//org.elasticsearch.indices.IndicesRequestCache.getOrCompute(IndicesRequestCache.java:125)
       app//org.elasticsearch.indices.IndicesService.cacheShardLevelResult(IndicesService.java:1402)
       app//org.elasticsearch.indices.IndicesService.loadIntoContext(IndicesService.java:1341)
       app//org.elasticsearch.search.SearchService.loadOrExecuteQueryPhase(SearchService.java:359)
       app//org.elasticsearch.search.SearchService.executeQueryPhase(SearchService.java:434)
       app//org.elasticsearch.search.SearchService.access$200(SearchService.java:135)
       app//org.elasticsearch.search.SearchService$2.lambda$onResponse$0(SearchService.java:395)
       app//org.elasticsearch.search.SearchService$2$$Lambda$5338/0x0000000801e35040.get(Unknown Source)
       app//org.elasticsearch.search.SearchService.lambda$runAsync$0(SearchService.java:411)
       app//org.elasticsearch.search.SearchService$$Lambda$5341/0x0000000801e35840.run(Unknown Source)
       app//org.elasticsearch.common.util.concurrent.TimedRunnable.doRun(TimedRunnable.java:44)
       app//org.elasticsearch.common.util.concurrent.ThreadContext$ContextPreservingAbstractRunnable.doRun(ThreadContext.java:692)
       app//org.elasticsearch.common.util.concurrent.AbstractRunnable.run(AbstractRunnable.java:37)
       java.base@14.0.1/java.util.concurrent.ThreadPoolExecutor.runWorker(ThreadPoolExecutor.java:1130)
       java.base@14.0.1/java.util.concurrent.ThreadPoolExecutor$Worker.run(ThreadPoolExecutor.java:630)
       java.base@14.0.1/java.lang.Thread.run(Thread.java:832)
     6/10 snapshots sharing following 10 elements
       java.base@14.0.1/jdk.internal.misc.Unsafe.park(Native Method)
       java.base@14.0.1/java.util.concurrent.locks.LockSupport.park(LockSupport.java:211)
       java.base@14.0.1/java.util.concurrent.LinkedTransferQueue.awaitMatch(LinkedTransferQueue.java:743)
       java.base@14.0.1/java.util.concurrent.LinkedTransferQueue.xfer(LinkedTransferQueue.java:684)
       java.base@14.0.1/java.util.concurrent.LinkedTransferQueue.take(LinkedTransferQueue.java:1366)
       app//org.elasticsearch.common.util.concurrent.SizeBlockingQueue.take(SizeBlockingQueue.java:165)
       java.base@14.0.1/java.util.concurrent.ThreadPoolExecutor.getTask(ThreadPoolExecutor.java:1056)
       java.base@14.0.1/java.util.concurrent.ThreadPoolExecutor.runWorker(ThreadPoolExecutor.java:1116)
       java.base@14.0.1/java.util.concurrent.ThreadPoolExecutor$Worker.run(ThreadPoolExecutor.java:630)
       java.base@14.0.1/java.lang.Thread.run(Thread.java:832)
   
    7.4% (36.9ms out of 500ms) cpu usage by thread 'elasticsearch[healthy_node][search][T#182]'
     2/10 snapshots sharing following 29 elements
       app//org.apache.lucene.search.ConjunctionDISI$BitSetConjunctionDISI.advance(ConjunctionDISI.java:284)
       app//org.apache.lucene.search.join.ToParentBlockJoinQuery$ParentApproximation.advance(ToParentBlockJoinQuery.java:231)
       app//org.apache.lucene.search.ConjunctionDISI.doNext(ConjunctionDISI.java:200)
       app//org.apache.lucene.search.ConjunctionDISI.nextDoc(ConjunctionDISI.java:240)
       app//org.apache.lucene.search.ConjunctionDISI$BitSetConjunctionDISI.doNext(ConjunctionDISI.java:288)
       app//org.apache.lucene.search.ConjunctionDISI$BitSetConjunctionDISI.nextDoc(ConjunctionDISI.java:279)
       app//org.apache.lucene.search.Weight$DefaultBulkScorer.scoreRange(Weight.java:244)
       app//org.apache.lucene.search.Weight$DefaultBulkScorer.score(Weight.java:229)
       app//org.elasticsearch.search.internal.CancellableBulkScorer.score(CancellableBulkScorer.java:56)
       app//org.apache.lucene.search.BulkScorer.score(BulkScorer.java:39)
       app//org.elasticsearch.search.internal.ContextIndexSearcher.searchLeaf(ContextIndexSearcher.java:212)
       app//org.elasticsearch.search.internal.ContextIndexSearcher.search(ContextIndexSearcher.java:185)
       app//org.apache.lucene.search.IndexSearcher.search(IndexSearcher.java:445)
       app//org.elasticsearch.search.query.QueryPhase.searchWithCollector(QueryPhase.java:344)
       app//org.elasticsearch.search.query.QueryPhase.executeInternal(QueryPhase.java:299)
       app//org.elasticsearch.search.query.QueryPhase.execute(QueryPhase.java:151)
       app//org.elasticsearch.search.SearchService.loadOrExecuteQueryPhase(SearchService.java:361)
       app//org.elasticsearch.search.SearchService.executeQueryPhase(SearchService.java:434)
       app//org.elasticsearch.search.SearchService.access$200(SearchService.java:135)
       app//org.elasticsearch.search.SearchService$2.lambda$onResponse$0(SearchService.java:395)
       app//org.elasticsearch.search.SearchService$2$$Lambda$5338/0x0000000801e35040.get(Unknown Source)
       app//org.elasticsearch.search.SearchService.lambda$runAsync$0(SearchService.java:411)
       app//org.elasticsearch.search.SearchService$$Lambda$5341/0x0000000801e35840.run(Unknown Source)
       app//org.elasticsearch.common.util.concurrent.TimedRunnable.doRun(TimedRunnable.java:44)
       app//org.elasticsearch.common.util.concurrent.ThreadContext$ContextPreservingAbstractRunnable.doRun(ThreadContext.java:692)
       app//org.elasticsearch.common.util.concurrent.AbstractRunnable.run(AbstractRunnable.java:37)
       java.base@14.0.1/java.util.concurrent.ThreadPoolExecutor.runWorker(ThreadPoolExecutor.java:1130)
       java.base@14.0.1/java.util.concurrent.ThreadPoolExecutor$Worker.run(ThreadPoolExecutor.java:630)
       java.base@14.0.1/java.lang.Thread.run(Thread.java:832)
     8/10 snapshots sharing following 2 elements
       java.base@14.0.1/java.util.concurrent.ThreadPoolExecutor$Worker.run(ThreadPoolExecutor.java:630)
       java.base@14.0.1/java.lang.Thread.run(Thread.java:832)


Here is another output from the same node.

::: {healthy_node}{Wa48OwSKSHG0_g8wOW3}{II_eBVVWRI6-EubxrZt}{101.101.101.24}{101.101.101.24:9300}{dir}{xpack.installed=true, transform.node=false}
   Hot threads at 2021-10-18T15:53:43.775Z, interval=500ms, busiestThreads=3, ignoreIdleThreads=true:
   
   10.3% (51.6ms out of 500ms) cpu usage by thread 'elasticsearch[healthy_node][search][T#163]'
     2/10 snapshots sharing following 11 elements
       app//org.elasticsearch.search.SearchService.access$200(SearchService.java:135)
       app//org.elasticsearch.search.SearchService$2.lambda$onResponse$0(SearchService.java:395)
       app//org.elasticsearch.search.SearchService$2$$Lambda$5338/0x0000000801e35040.get(Unknown Source)
       app//org.elasticsearch.search.SearchService.lambda$runAsync$0(SearchService.java:411)
       app//org.elasticsearch.search.SearchService$$Lambda$5341/0x0000000801e35840.run(Unknown Source)
       app//org.elasticsearch.common.util.concurrent.TimedRunnable.doRun(TimedRunnable.java:44)
       app//org.elasticsearch.common.util.concurrent.ThreadContext$ContextPreservingAbstractRunnable.doRun(ThreadContext.java:692)
       app//org.elasticsearch.common.util.concurrent.AbstractRunnable.run(AbstractRunnable.java:37)
       java.base@14.0.1/java.util.concurrent.ThreadPoolExecutor.runWorker(ThreadPoolExecutor.java:1130)
       java.base@14.0.1/java.util.concurrent.ThreadPoolExecutor$Worker.run(ThreadPoolExecutor.java:630)
       java.base@14.0.1/java.lang.Thread.run(Thread.java:832)
     8/10 snapshots sharing following 10 elements
       java.base@14.0.1/jdk.internal.misc.Unsafe.park(Native Method)
       java.base@14.0.1/java.util.concurrent.locks.LockSupport.park(LockSupport.java:211)
       java.base@14.0.1/java.util.concurrent.LinkedTransferQueue.awaitMatch(LinkedTransferQueue.java:743)
       java.base@14.0.1/java.util.concurrent.LinkedTransferQueue.xfer(LinkedTransferQueue.java:684)
       java.base@14.0.1/java.util.concurrent.LinkedTransferQueue.take(LinkedTransferQueue.java:1366)
       app//org.elasticsearch.common.util.concurrent.SizeBlockingQueue.take(SizeBlockingQueue.java:165)
       java.base@14.0.1/java.util.concurrent.ThreadPoolExecutor.getTask(ThreadPoolExecutor.java:1056)
       java.base@14.0.1/java.util.concurrent.ThreadPoolExecutor.runWorker(ThreadPoolExecutor.java:1116)
       java.base@14.0.1/java.util.concurrent.ThreadPoolExecutor$Worker.run(ThreadPoolExecutor.java:630)
       java.base@14.0.1/java.lang.Thread.run(Thread.java:832)


Thanks. The healthy and slow node differ because one uses a cache of results and the other doesn't.
Their stack traces differ in execution from this decision point

Perhaps the node settings differ in the space allocated to caches?

That's weird.
They use the same Elasticsearch.yml(same md5sum).
How the cache data become different while under the same traffic?

The comments in the logic that determines if a search "canCache" show some reasons why a search may not be cachable : elasticsearch/IndicesService.java at master · elastic/elasticsearch · GitHub

Given this is a production environment and you may not have full control over the executing searches under diagnosis it will be hard to dig into this deeper.

It is fair to say though that given identical hardware, software, configuration, data and queries any difference between nodes is likely to come down to caches.

Yes, there's no way to work around the limitations of the java.policy, we can't use instumentation technology like btrace/greys to dig deeper.

In fact, it's a 100+ nodes cluster and they have been working well online for a long time. Somehow, that node suddenly went wrong. We still don't know what triggered this problem so far. What makes us more frightened is that we don’t know who it is the next one.

Any suggestions that can help us avoid/improve this problem?

You could enable the slow query log to get some insight into what queries are being used.