Hi
I have a question. Dose it possible to calculate the percentage using already aggregated fields.
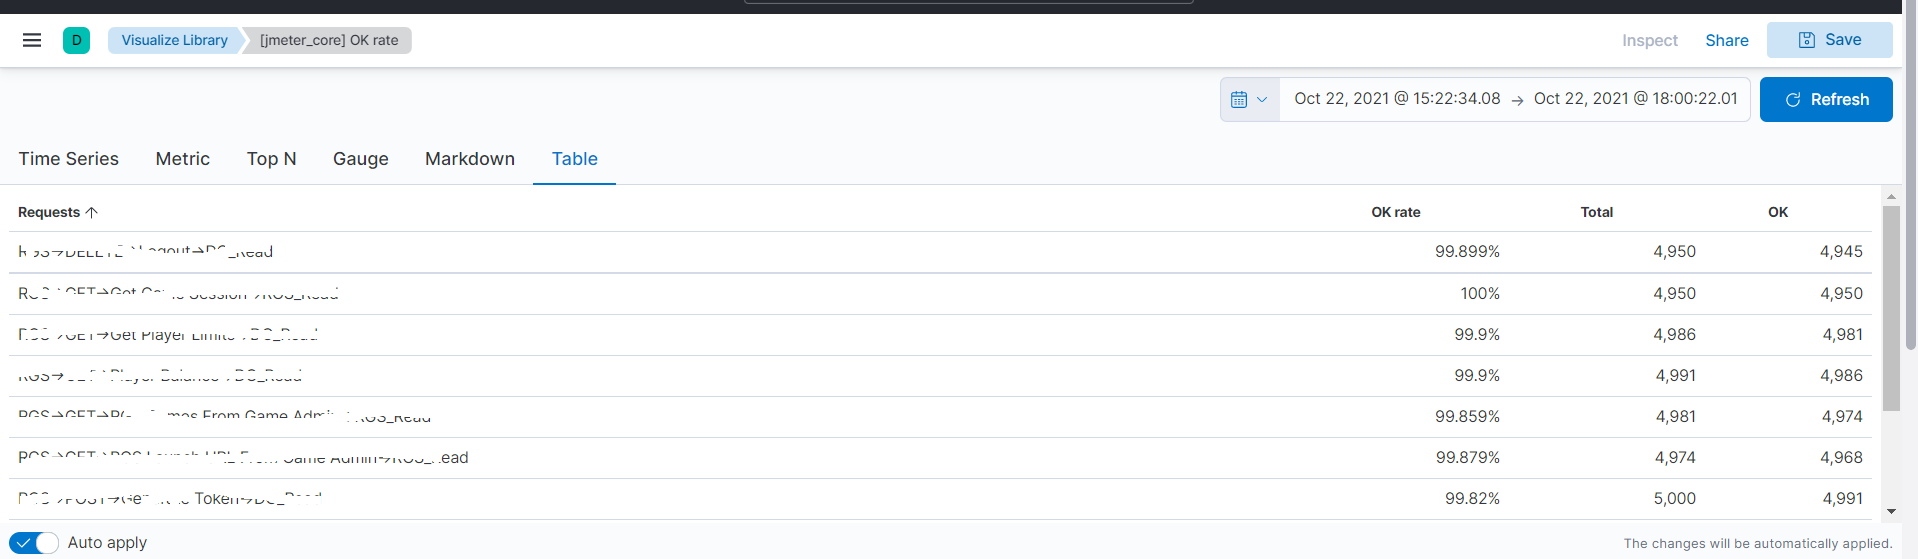
I have two columns aggregated and grouped by Buckets ( split rows was used):
- Sum of items (jmeter.count)
- Sum of items (jmeter.success_count)
I want to have a new column with calculation represented in percentage
jmeter.success_count/jmeter.count
What is the solution to archive that?
Any alternatives to visualize?
Hey @Michael_Derevyanko,
I don't think you can do this with a data table in Visualize, but I think you can do this with a data table in Canvas!
Take a look at this tutorial:
Using the sample data that comes with Kibana, I crafted the following data table in Canvas, which I believe mirrors what you're trying to achieve:
filters
| essql query="SELECT *, total_price/total_quantity as price_per_quantity FROM (SELECT geoip.continent_name, SUM(taxful_total_price) as total_price, SUM(total_quantity) as total_quantity FROM \"kibana_sample_data_ecommerce\" GROUP BY geoip.continent_name)"
| table
| render
And, just for readability, the SQL is:
SELECT *, total_price/total_quantity as price_per_quantity FROM
  (
    SELECT
      geoip.continent_name,
      SUM(taxful_total_price) as total_price,
      SUM(total_quantity) as total_quantity
    FROM "kibana_sample_data_ecommerce"
    GROUP BY geoip.continent_name
  )
Is that helpful? You would be grouping by request name and using jmeter values instead of the price/quantity.
Brian
Many thanks @brianseeders will take a look for sure for that approach as well.
I have find out the solution to use TSVB table,
The result of usage
BR,
Mike
Another solution would be to use Lens Formulas:
sum(jmeter.success_count) / sum(jmeter.count)
And set a Percent Formatter.