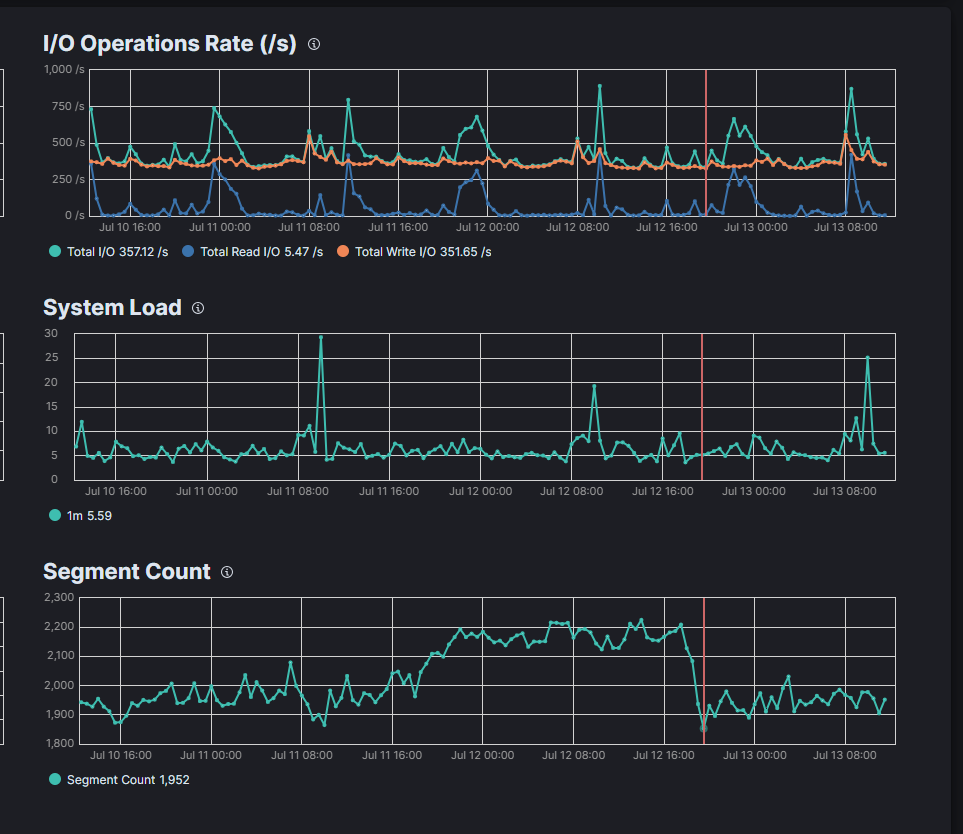
Above is my elastic 3 days IO rate chart, it does have a special pattern between every 12 hours, the read will reach to a peak, but I am not sure what is the thing that can potentially cause this happens... is there a way to find it out?
currently, I have set up couple watchers, but it runs per 10mins, and I did not set anything related to read/search per 12 hours .
Thanks for the reply.
I capture my segment count chart picure below, but seems like the time does not match... when the segment count has a huge drop, the read rate andrthe write rate is not very high,
Apache, Apache Lucene, Apache Hadoop, Hadoop, HDFS and the yellow elephant
logo are trademarks of the
Apache Software Foundation
in the United States and/or other countries.