Can we enable stack trace for all the calls in the Custom Python Tracing

hi @basepi & @lwintergerst ,

How can we enable stack trace for all the calls in the waterfall model.

Right now errors /exceptions has the stack trace.

Want to track all the calls which are greater than 5 seconds with stack trace attached when we try to see the details .

is this possible, I know overhead would be accounting for the same.

Thanks,
Dixit

Please stop mentioning Elastic team members directly. If you create a post on the APM forum labeled python, we will see it.

All spans longer than span_stack_trace_min_duration should have stack traces attached by default.

1 Like

Thank you
Will try and let you know

hi ,

Am not getting stack trace even though span_stack_trace_min_duration is added and set to 0 or some value in "ms" format.

Not sure why, can you help me. Where exactly if I place this I get a stack trace, am experimenting

You're looking in the correct place. That's where I see stack traces for spans in our test cluster.

Can you show me all of your (sanitized) config values? I want to make sure we're not missing something in configuration.


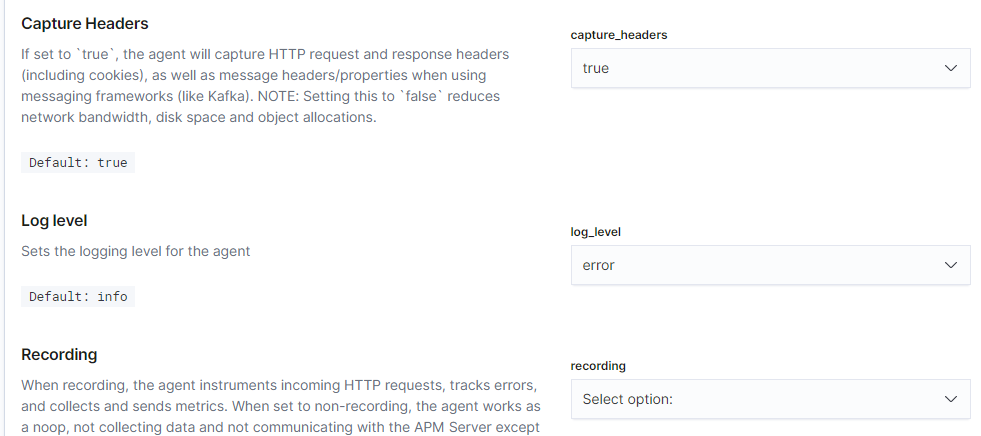
In your screenshot, you have span_frames_min_duration set to 5ms, and the span you were looking at was 1.3ms.

span_stack_trace_min_duration is replacing span_frames_min_duration but I'm not sure which version of the UI will have that change. The new setting will take precedence, but the old setting will still work if the new setting is not set.

Then will delete / reset the configs then try to see the stack trace.

What would be the default setting look like , any example would help

If you want to see stack traces from all spans (including the short ones), you would set that setting to 0ms in Kibana.

Alternatively, you could configure it on the agent side, either via environment variables or in-code config.

Note that collecting stack traces has some performance overhead. We assume that most users won't want to inspect the stack trace on spans that are less than 5ms, because they are usually not the problematic spans. Thus, the default of 5ms.

Yes 5 ms is fair enough. My question is I want to see what is going in as in for memmcache, trying to trace that.

Any documentation for kibana would help where the setting needs to be

This topic was automatically closed 20 days after the last reply. New replies are no longer allowed.