Hi @drewdaemon , hope you are doing well.
Can we write a query that will extract the common value that is stored in Elasticsearch for 7 days and create the visualisation for the extracted information?
Hi @Tanzeela: is your data stored with each recorded piece of equipment being a document in your index?
For example
{
  "@timestamp": "sometime in day 1",
  "equipmentId": "A1",
}

{
  "@timestamp": "sometime in day 1",
  "equipmentId": "A2",
}

{
  "@timestamp": "sometime in day 1",
  "equipmentId": "A3",
}
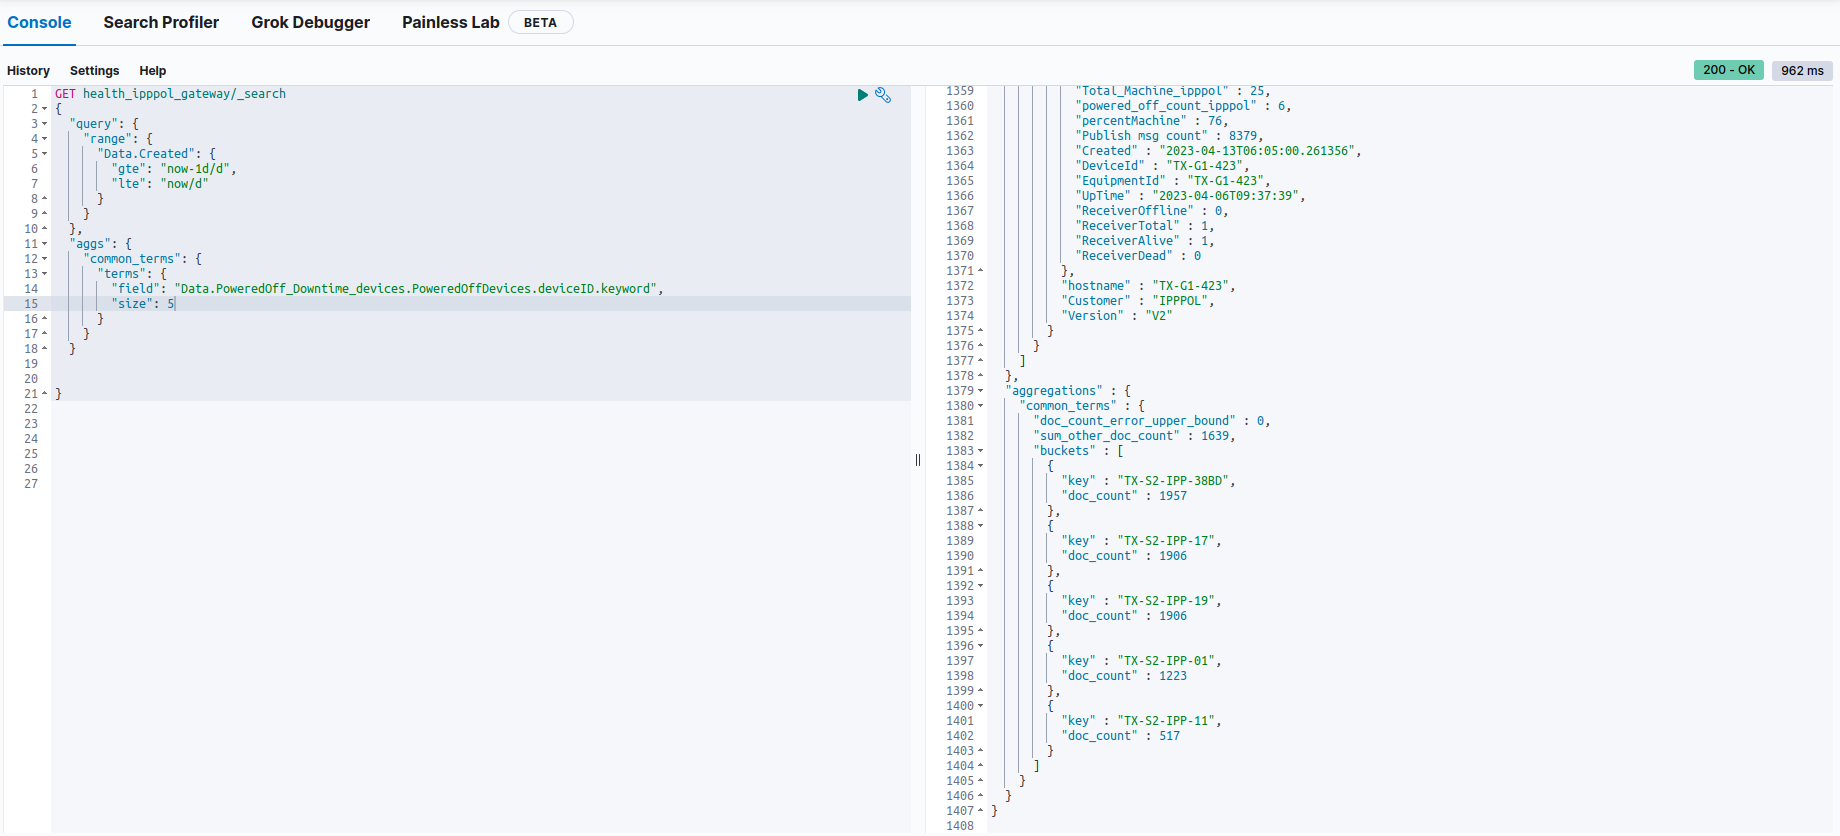
After 1 minute, our data appears in Kibana and is saved in the poweredoffDevices list as shown in attached figure.
I want to extract the common value of poweredoffDevices that comes from 7 days and keep that information in a list or variable to create a visualisation that shows the following devices that have been powered off for 7 days. Is there any way to do this task?
Okay, so essentially your data is being ingested in one-minute buckets, one document per bucket.
I do have an idea as to how to do this, but it will be a big effort and will require you to learn several Elastic technologies since we don't support this out-of-the-box.
You'd probably need to
compose a custom Elasticsearch query to return the results you need
build a custom visualization to display the results of that query
If you want to try, I would start by using the dev console to get the Elasticsearch query right.
I believe you'll need to define a custom aggregation in your query. I'd try the scripted metric which allows you to define custom logic for the map-reduce phases. My guess is that you can use this to gather only the devices that are in common for all the documents.
Once the query is returning the right results, you'd need to use Vega to define a custom visualization.
We are currently working on a query language called ESQL. Hopefully when that lands, it will make this a lot easier by allowing you to use Lens.
According to your instructions, I think I am near to it, but I am not satisfied with the results, Could you please help me out How can i get the desired results?
It would be highly appreciated if you provide me a helping material links so i can develop my understanding on Vega to define a custom visualization.
I hope ESQL will be the life changing tool for everyone.
It looks like you're trying some good approaches, but I just want to emphasize that while I think it is possible, making this work with our current product is unfortunately a (very) big task.
As far as the Elasticsearch request goes, like I say above,
I don't think that our available aggregations can do what you're trying to accomplish, so as far as I can tell you'd have to write your own scripted metric aggregation. Using this, you define logic for the various phases of aggregation yourself using one of our scripting languages such as Painless.
Sure, the Vega website is a good place to start. You can find tutorials, docs, and examples there.
Apache, Apache Lucene, Apache Hadoop, Hadoop, HDFS and the yellow elephant
logo are trademarks of the
Apache Software Foundation
in the United States and/or other countries.