Can't etablish connection with logstash and my filebeat 7.17.1

Hi all,

I want to do a monitoring of my log but i don't understand why my logstash doesn't"t work with filebeat.

For now i have Elasticsearch:
Elasticsearch.yml

node.name: master-node-1
node.master: true
cluster.initial_master_nodes:
  - master-node-1

path.data: /var/lib/elasticsearch
path.logs: /var/log/elasticsearch

network.host: 192.168.66.11
http.port: 9200

kibana:
kibana.yml

server.port: 5601
server.host: "192.168.66.11"

logstash:
pipelines.yml

- pipeline.id: main
  path.config: "/etc/logstash/conf.d/*.conf"
  pipeline.workers: 1

logstash-beat-electric.conf

input {
  beats {
    port => 5044
    id => "from_filebeat"
  }
}
output {
  elasticsearch {
    hosts => ["http://192.168.66.11:9200"]
    index => "%{[@metadata][beat]}-%{[@metadata][version]}-%{+YYYY.MM.dd}"
  }
}
filter {
...
}

filebeat:
filebeat.yml

- type: log

  enabled: true

  paths:
    - /home/ttc/epnp-docker-share/bowl-automotive/tmp/reference-data/*.log
  tags: ["iocore_data"]

- type: filestream
  enabled: false
  paths:
    - /var/log/*.log
filebeat.config.modules:
  path: ${path.config}/modules.d/*.yml
  reload.enabled: false

setup.template.settings:
  index.number_of_shards: 1

setup.kibana:
  host: "192.168.66.11:5601"

output.logstash:
  hosts: ["192.168.66.11:5044"]

processors:
  - add_host_metadata:
      when.not.contains.tags: forwarded
  - add_cloud_metadata: ~
  - add_docker_metadata: ~
  - add_kubernetes_metadata: ~

when i start filebeat i got this:

juin 08 17:36:13 pcttc filebeat[226686]: 2022-06-08T17:36:13.128+0200        ERROR        [publisher_pipeline_output]        pipeline/output.go:154        Failed to connect to backoff(async(tcp://192.168.66.11:5044)): dial tcp 192.168.66.11:5044: connect: no route to host>

for logstash:

juin 08 16:09:06 cluster logstash[8194]: [2022-06-08T16:09:06,383][WARN ][logstash.outputs.elasticsearch][main] Detected a 6.x and above cluster: the `type` event field won't be used to determine the document _type {:es_version=>7}
juin 08 16:09:06 cluster logstash[8194]: [2022-06-08T16:09:06,405][INFO ][logstash.outputs.elasticsearch][main] Config is not compliant with data streams. `data_stream => auto` resolved to `false`
juin 08 16:09:06 cluster logstash[8194]: [2022-06-08T16:09:06,492][WARN ][logstash.javapipeline    ][main] 'pipeline.ordered' is enabled and is likely less efficient, consider disabling if preserving event order is not necessary
juin 08 16:09:07 cluster logstash[8194]: [2022-06-08T16:09:07,679][INFO ][logstash.inputs.beats    ][main] Starting input listener {:address=>"0.0.0.0:5044"}
Juin 08 16:09:07 cluster logstash[8194]: [2022-06-08T16:09:07,694][INFO ][logstash.javapipeline    ][main] Pipeline started {"pipeline.id"=>"main"}
juin 08 16:09:07 cluster logstash[8194]: [2022-06-08T16:09:07,862][INFO ][logstash.agent           ] Pipelines running {:count=>1, :running_pipelines=>[:main], :non_running_pipelines=>[]}
juin 08 16:09:07 cluster logstash[8194]: [2022-06-08T16:09:07,904][INFO ][org.logstash.beats.Server][main][from_filebeat] Starting server on port: 5044

Here is my "log"

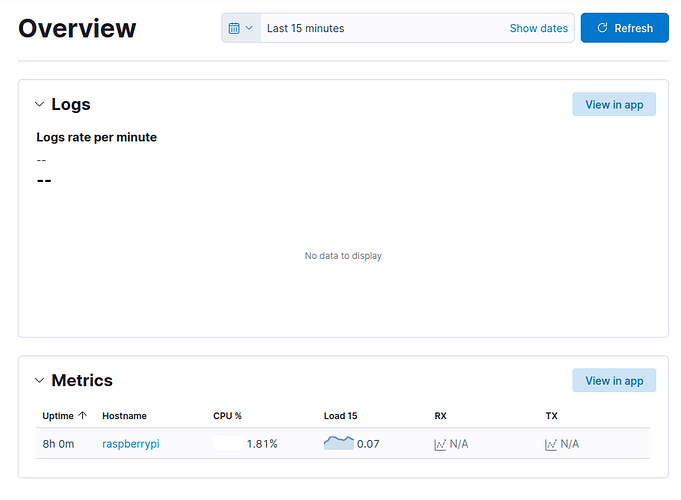
As we can see metricbeat is working so Elasticsearch and kibana works i think.

First of all i don't understand why logstash listen: address=>"0.0.0.0:5044"

and i don't know why my logstash or filebeat doesn't work.

Can i have some help pls ?
0.0.0.0 is usually interpreted by the TCP stack as "all public addresses", although some stacks have slightly different interpretations. You could explicitly set the host option on the beats input to match the IP address you set in filebeat.

When you say

the beats input

it's in the logstash ?

Yes.

I try but it's the same result,
So i install a logstach into another computer and it's work...
I do exactly the same as before but I don't understand why I'm getting this:

my logstash that doesn't work:

[WARN ][logstash.outputs.elasticsearch][main] Detected a 6.x and above cluster: the `type` event field won't be used to determine the document _type {:es_version=>7}
[INFO ][logstash.outputs.elasticsearch][main] Config is not compliant with data streams. `data_stream => auto` resolved to `false`
[INFO ][logstash.outputs.elasticsearch][main] Config is not compliant with data streams. `data_stream => auto` resolved to `false`
[INFO ][logstash.outputs.elasticsearch][main] Using a default mapping template {:es_version=>7, :ecs_compatibility=>:disabled}
[INFO ][logstash.javapipeline    ][main] Starting pipeline {:pipeline_id=>"main", "pipeline.workers"=>8, "pipeline.batch.size"=>125, "pipeline.batch.delay"=>50, "pipeline.max_inflight"=>1000, "pipeline.sources"=>["/etc/logstash/conf.d/logstash-beat-electic.conf"], :thread=>"#<Thread:0x46e88eda run>"}
[INFO ][logstash.javapipeline    ][main] Pipeline Java execution initialization time {"seconds"=>1.26}
[INFO ][logstash.inputs.beats    ][main] Starting input listener {:address=>"0.0.0.0:5044"}
[INFO ][logstash.javapipeline    ][main] Pipeline started {"pipeline.id"=>"main"}
[INFO ][logstash.agent           ] Pipelines running {:count=>1, :running_pipelines=>[:main], :non_running_pipelines=>[]}
[INFO ][org.logstash.beats.Server][main][from_filebeat] Starting server on port: 5044

and the another logstash but it work:

juin 09 12:19:21 EB-epicnpoc logstash[21949]: [2022-06-09T12:19:21,121][WARN ][logstash.outputs.elasticsearch][main] Detected a 6.x and above cluster: the `type` event field won't be used to determine the document _type {:es_version=>7}
juin 09 12:19:21 EB-epicnpoc logstash[21949]: [2022-06-09T12:19:21,255][INFO ][logstash.outputs.elasticsearch][main] Config is not compliant with data streams. `data_stream => auto` resolved to `false`
juin 09 12:19:21 EB-epicnpoc logstash[21949]: [2022-06-09T12:19:21,257][INFO ][logstash.outputs.elasticsearch][main] Config is not compliant with data streams. `data_stream => auto` resolved to `false`
juin 09 12:19:21 EB-epicnpoc logstash[21949]: [2022-06-09T12:19:21,296][INFO ][logstash.outputs.elasticsearch][main] Using a default mapping template {:es_version=>7, :ecs_compatibility=>:disabled}
juin 09 12:19:21 EB-epicnpoc logstash[21949]: [2022-06-09T12:19:21,348][INFO ][logstash.javapipeline    ][main] Starting pipeline {:pipeline_id=>"main", "pipeline.workers"=>16, "pipeline.batch.size"=>125, "pipeline.batch.delay"=>50, "pipeline.max_inflight"=>2000, "pipeline.sources"=>["/etc/logstash/conf.d/logstash-beat-electric.conf"], :thread=>"#<Thread:0x725c9ca4 run>"}
juin 09 12:19:22 EB-epicnpoc logstash[21949]: [2022-06-09T12:19:22,157][INFO ][logstash.javapipeline    ][main] Pipeline Java execution initialization time {"seconds"=>0.8}
juin 09 12:19:22 EB-epicnpoc logstash[21949]: [2022-06-09T12:19:22,182][INFO ][logstash.inputs.beats    ][main] Starting input listener {:address=>"0.0.0.0:5044"}
juin 09 12:19:22 EB-epicnpoc logstash[21949]: [2022-06-09T12:19:22,194][INFO ][logstash.javapipeline    ][main] Pipeline started {"pipeline.id"=>"main"}
juin 09 12:19:22 EB-epicnpoc logstash[21949]: [2022-06-09T12:19:22,241][INFO ][logstash.agent           ] Pipelines running {:count=>1, :running_pipelines=>[:main], :non_running_pipelines=>[]}
juin 09 12:19:22 EB-epicnpoc logstash[21949]: [2022-06-09T12:19:22,313][INFO ][org.logstash.beats.Server][main][from_filebeat] Starting server on port: 5044

As we can see it doesn't have the same setting

"pipeline.workers"=>16, "pipeline.max_inflight"=>2000, :thread=>"#<Thread:0x725c9ca4 run>
"pipeline.workers"=>8, "pipeline.max_inflight"=>1000, :thread=>"#<Thread:0x46e88eda run>

It can be that ?

Ok i found the problem it's because i used

sudo firewall-cmd --add-port=9200/tcp --permanent

for the last Elasticsearch 8.2 now I need to do that for port 5044.

sudo firewall-cmd --add-port=5044/tcp --permanent
sudo firewall-cmd --add-port=9200/udp --permanent

This topic was automatically closed 28 days after the last reply. New replies are no longer allowed.