Hello, I have a custom index called "sysmon", I am sending a log to this index, from an iotop process that logs I/O count by process name,
the data is showing up in Discover, and I can see my custom fields w data (diskio, pid, data,etc)

These fields are extracted using this grok pattern,
root@vulcan:logstash $ cat conf.d/iotop.conf
    input {
      beats { port => 5044 }
    }

    filter {
    	grok {
            match => { "message" => "%{NUMBER:hour}:%{NUMBER:minute}:%{NUMBER:second} %{NUMBER:pid} (?<be>[a-z].[\/][0-9]+) %{WORD:user} %{SPACE} %{NUMBER:diskr} (?<diskrkb>[A-Z]..) %{SPACE} %{NUMBER:diskw} (?<diskwkb>[A-Z]..) %{SPACE} %{NUMBER:swapin} %{NOTSPACE} %{SPACE} %{NUMBER:io} %{NOTSPACE} %{GREEDYDATA:data}" }
          }
    }

    output {
      elasticsearch {
    	hosts => ["vulcan:9200"]
    	index => "sysmon"
      }
    }
I want to create a Data table to display processes that have the highest disk I/O, but cant get any of my fields to show up, only 2 fields are available on this index,
@timestamp and log.offset
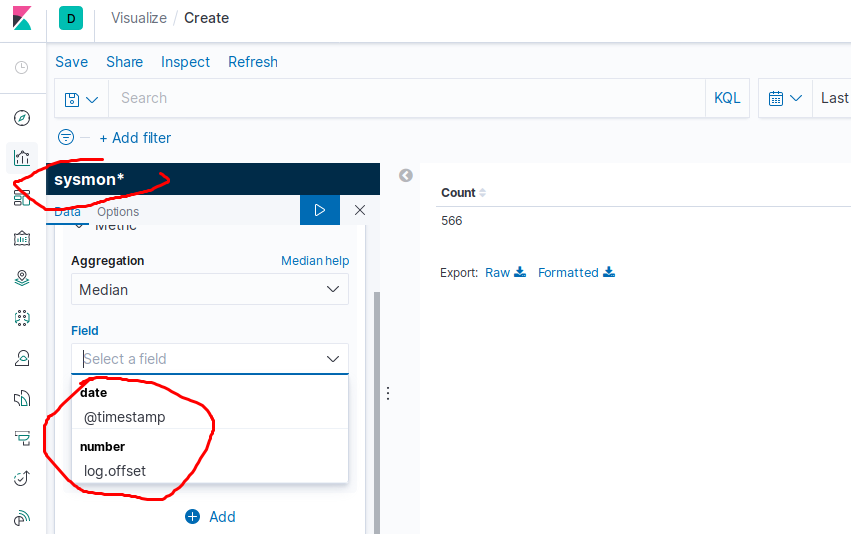
How do I get other fields to show up?
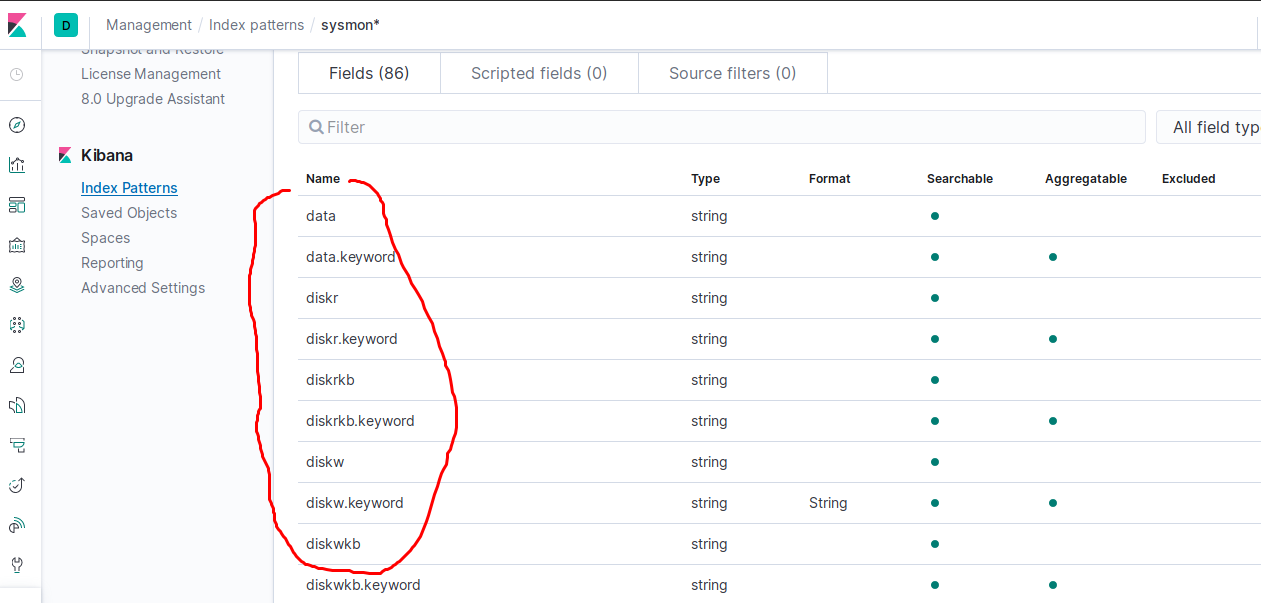
btw, if I look at Settings > Index Patterns the custom fields are there,