Hello everyone,
I would like to create a set of dataset from Visualize Library since some of the templates that I see can be more powerful than Lens / Dashboard since you can set infinite about of data/values to show - instead of 100 values only.
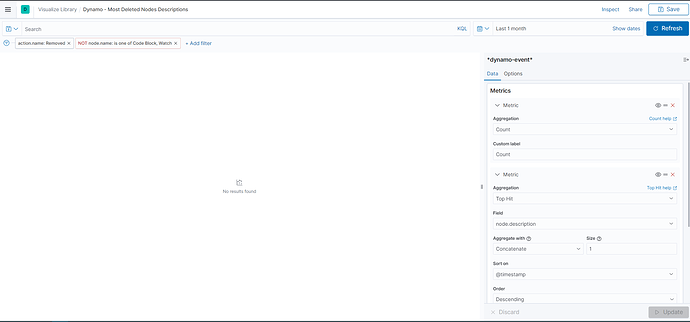
However when I just click Visualize Library, it is the same as dashboard and value limit is only up to 100. I click into one of the data table templates but I cannot change it to other field ( I would like to use LOG but its DYNAMO-EVENT here.
Could someone guide me how to customize my visual library from the beginning so that I can replicate a type of dashboard that resembles the templates provided by Elastic Cloud?
I am mostly interested in a data table dashboard where I can have more than 100 values.
Thank you!

