Cluster status to RED while indexing and searching at same time

Hi,

We recently deployed new Search functionality and day after moving things to Production, our ES server blacks out every other day. I was able to replicate the scenario in our QA servers now.
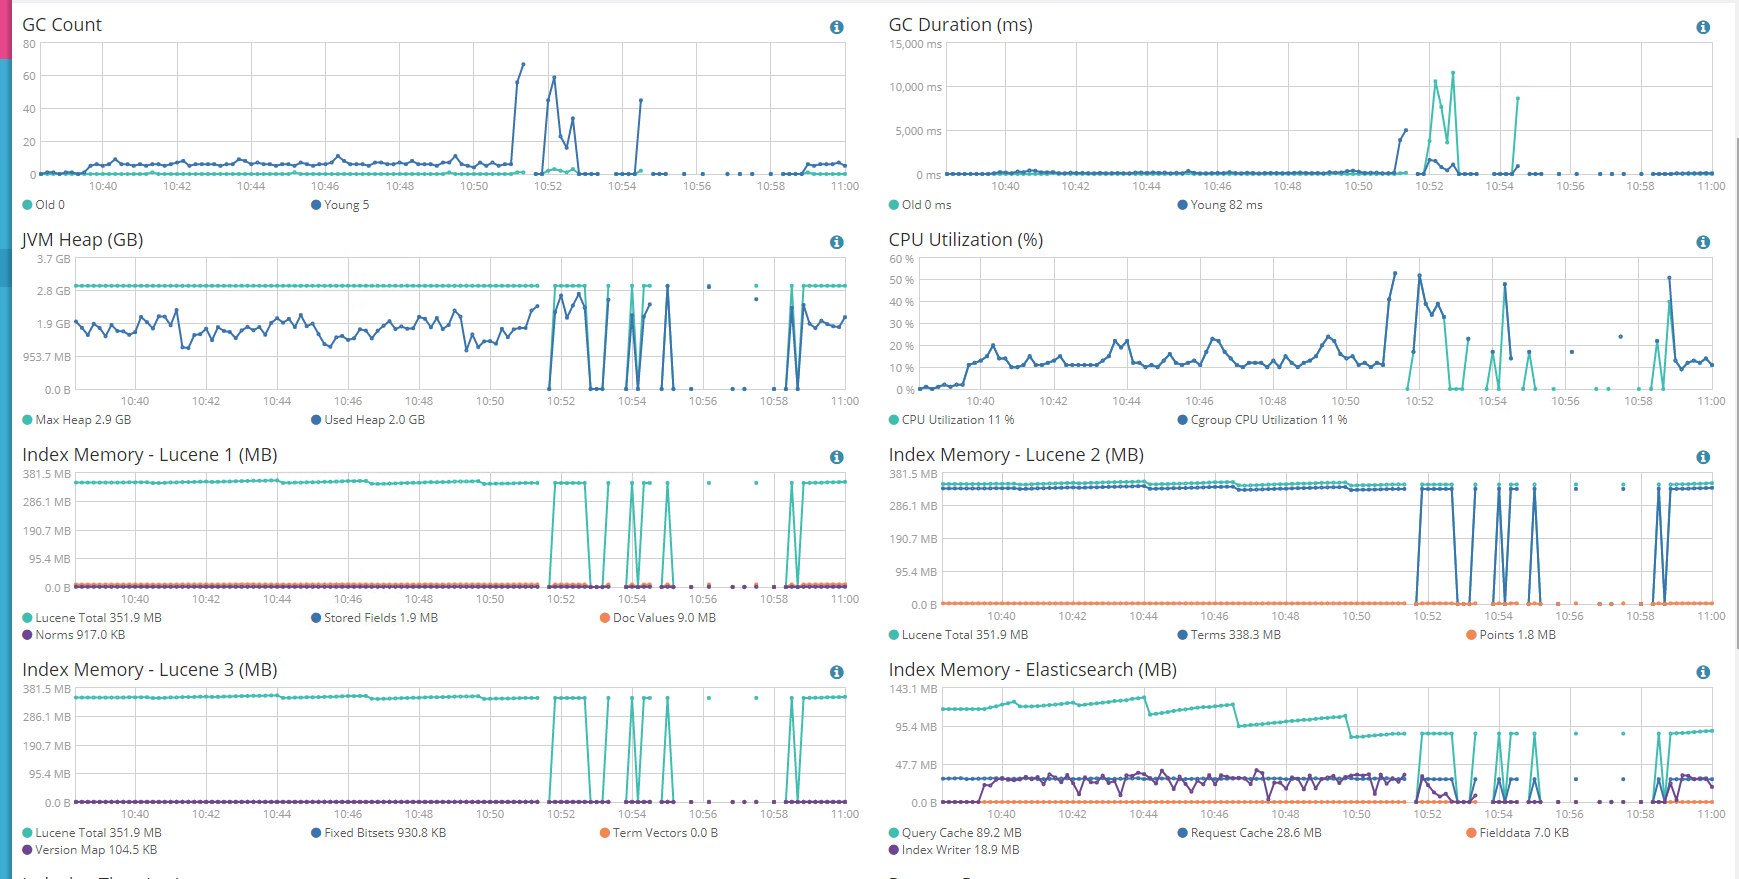
While indexing 30k records and searching at the same time, server turns to RED. I have to restart the service again or wait for 10-12 mins.

I allocated 3 GB for JVM Heap in out QA server but Production server has 20GB for JVM. Not sure how to resolve the issue. Any help is greatly appreciated.

Information from log files:
[2018-08-26T11:15:17,449][INFO ][o.e.m.j.JvmGcMonitorService] [vtamsweb2] [gc][1235248] overhead, spent [586ms] collecting in the last [1.4s]
[2018-08-26T11:15:18,603][WARN ][o.e.m.j.JvmGcMonitorService] [vtamsweb2] [gc][1235249] overhead, spent [670ms] collecting in the last [1.1s]
[2018-08-26T11:16:01,873][WARN ][o.e.m.j.JvmGcMonitorService] [vtamsweb2] [gc][old][1235250][136] duration [42.4s], collections [2]/[43.3s], total [42.4s]/[10.1m], memory [2.5gb]->[1.3gb]/[2.9gb], all_pools {[young] [2.9mb]->[13.9mb]/[532.5mb]}{[survivor] [65.6mb]->[0b]/[66.5mb]}{[old] [1.9gb]->[1.3gb]/[2.3gb]}
[2018-08-26T11:16:01,873][WARN ][o.e.m.j.JvmGcMonitorService] [vtamsweb2] [gc][1235250] overhead, spent [42.9s] collecting in the last [43.3s]
[2018-08-26T11:16:01,907][ERROR][o.e.x.m.c.i.IndexStatsCollector] [vtamsweb2] collector [index-stats-collector] timed out when collecting data
[2018-08-26T11:16:11,198][INFO ][o.e.m.j.JvmGcMonitorService] [vtamsweb2] [gc][1235259] overhead, spent [262ms] collecting in the last [1s]
[2018-08-26T11:16:14,595][INFO ][o.e.m.j.JvmGcMonitorService] [vtamsweb2] [gc][1235262] overhead, spent [350ms] collecting in the last [1.2s]
[2018-08-26T11:16:16,688][INFO ][o.e.m.j.JvmGcMonitorService] [vtamsweb2] [gc][1235264] overhead, spent [271ms] collecting in the last [1s]
[2018-08-26T11:16:18,825][INFO ][o.e.m.j.JvmGcMonitorService] [vtamsweb2] [gc][1235266] overhead, spent [278ms] collecting in the last [1s]
[2018-08-26T11:16:23,537][WARN ][o.e.m.j.JvmGcMonitorService] [vtamsweb2] [gc][1235267] overhead, spent [3.9s] collecting in the last [4.7s]
[2018-08-26T11:16:25,830][INFO ][o.e.m.j.JvmGcMonitorService] [vtamsweb2] [gc][1235269] overhead, spent [308ms] collecting in the last [1.2s]
[2018-08-26T11:16:29,341][WARN ][o.e.m.j.JvmGcMonitorService] [vtamsweb2] [gc][1235270] overhead, spent [3.3s] collecting in the last [3.5s]
[2018-08-26T11:16:35,378][ERROR][o.e.x.m.c.i.IndexStatsCollector] [vtamsweb2] collector [index-stats-collector] timed out when collecting data
[2018-08-26T11:16:35,800][WARN ][o.e.m.j.JvmGcMonitorService] [vtamsweb2] [gc][1235273] overhead, spent [3.5s] collecting in the last [4.4s]
[2018-08-26T11:16:36,814][INFO ][o.e.m.j.JvmGcMonitorService] [vtamsweb2] [gc][1235274] overhead, spent [274ms] collecting in the last [1s]
[2018-08-26T11:16:40,621][WARN ][o.e.m.j.JvmGcMonitorService] [vtamsweb2] [gc][1235275] overhead, spent [3.4s] collecting in the last [3.8s]
[2018-08-26T11:16:45,254][WARN ][o.e.m.j.JvmGcMonitorService] [vtamsweb2] [gc][1235276] overhead, spent [4s] collecting in the last [4.6s]
[2018-08-26T11:16:45,691][ERROR][o.e.x.m.c.c.ClusterStatsCollector] [vtamsweb2] collector [cluster-stats-collector] timed out when collecting data
[2018-08-26T11:16:49,749][WARN ][o.e.m.j.JvmGcMonitorService] [vtamsweb2] [gc][1235277] overhead, spent [4s] collecting in the last [4.4s]
[2018-08-26T11:16:54,102][WARN ][o.e.m.j.JvmGcMonitorService] [vtamsweb2] [gc][1235278] overhead, spent [3.9s] collecting in the last [4.3s]
[2018-08-26T11:16:58,845][WARN ][o.e.m.j.JvmGcMonitorService] [vtamsweb2] [gc][1235279] overhead, spent [4.2s] collecting in the last [4.7s]
[2018-08-26T11:17:03,510][WARN ][o.e.m.j.JvmGcMonitorService] [vtamsweb2] [gc][1235280] overhead, spent [4.1s] collecting in the last [4.6s]
[2018-08-26T11:17:08,638][WARN ][o.e.m.j.JvmGcMonitorService] [vtamsweb2] [gc][1235282] overhead, spent [3.6s] collecting in the last [3.7s]
[2018-08-26T11:17:13,138][WARN ][o.e.m.j.JvmGcMonitorService] [vtamsweb2] [gc][1235284] overhead, spent [3.4s] collecting in the last [3.5s]
[2018-08-26T11:17:18,837][WARN ][o.e.m.j.JvmGcMonitorService] [vtamsweb2] [gc][1235286] overhead, spent [3.6s] collecting in the last [4.4s]
[2018-08-26T11:17:23,993][WARN ][o.e.m.j.JvmGcMonitorService] [vtamsweb2] [gc][1235288] overhead, spent [3.6s] collecting in the last [4.1s]
[2018-08-26T11:17:29,117][WARN ][o.e.m.j.JvmGcMonitorService] [vtamsweb2] [gc][1235289] overhead, spent [4.3s] collecting in the last [5.1s]
[2018-08-26T11:17:34,097][WARN ][o.e.m.j.JvmGcMonitorService] [vtamsweb2] [gc][1235290] overhead, spent [4.1s] collecting in the last [4.9s]
[2018-08-26T11:17:39,364][WARN ][o.e.m.j.JvmGcMonitorService] [vtamsweb2] [gc][1235291] overhead, spent [4.4s] collecting in the last [5.2s]
[2018-08-26T11:17:44,131][WARN ][o.e.m.j.JvmGcMonitorService] [vtamsweb2] [gc][1235292] overhead, spent [4.2s] collecting in the last [4.7s]
[2018-08-26T11:17:49,878][WARN ][o.e.m.j.JvmGcMonitorService] [vtamsweb2] [gc][1235294] overhead, spent [3.7s] collecting in the last [4.5s]
[2018-08-26T11:17:55,494][WARN ][o.e.m.j.JvmGcMonitorService] [vtamsweb2] [gc][1235296] overhead, spent [4s] collecting in the last [4.5s]
[2018-08-26T11:18:00,503][WARN ][o.e.m.j.JvmGcMonitorService] [vtamsweb2] [gc][1235298] overhead, spent [3.2s] collecting in the last [3.9s]
[2018-08-26T11:18:06,063][WARN ][o.e.m.j.JvmGcMonitorService] [vtamsweb2] [gc][1235300] overhead, spent [3.8s] collecting in the last [4.4s]
[2018-08-26T11:18:07,389][INFO ][o.e.m.j.JvmGcMonitorService] [vtamsweb2] [gc][1235301] overhead, spent [410ms] collecting in the last [1s]
[2018-08-26T11:18:11,483][WARN ][o.e.m.j.JvmGcMonitorService] [vtamsweb2] [gc][1235302] overhead, spent [3.8s] collecting in the last [4.3s]
[2018-08-26T11:18:16,199][WARN ][o.e.m.j.JvmGcMonitorService] [vtamsweb2] [gc][1235303] overhead, spent [4.1s] collecting in the last [4.7s]
[2018-08-26T11:18:20,183][WARN ][o.e.m.j.JvmGcMonitorService] [vtamsweb2] [gc][1235304] overhead, spent [3.6s] collecting in the last [3.9s]
[2018-08-26T11:18:24,100][WARN ][o.e.m.j.JvmGcMonitorService] [vtamsweb2] [gc][1235305] overhead, spent [3.2s] collecting in the last [3.9s]
[2018-08-26T11:18:25,146][INFO ][o.e.m.j.JvmGcMonitorService] [vtamsweb2] [gc][1235306] overhead, spent [467ms] collecting in the last [1s]
[2018-08-26T11:18:28,267][WARN ][o.e.m.j.JvmGcMonitorService] [vtamsweb2] [gc][1235307] overhead, spent [2.8s] collecting in the last [3.1s]
[2018-08-26T11:18:29,375][INFO ][o.e.m.j.JvmGcMonitorService] [vtamsweb2] [gc][1235308] overhead, spent [434ms] collecting in the last [1.1s]

It looks like you are suffering from heap pressure, so I would recommend trying to increase the size of the heap.

Hi @Christian_Dahlqvist,

I gave 20GB to JVM heap in production server.

-Xms20g
-Xmx20g

Initial heap size was 30GB in prod server but from what I read, GC might take long time to clean the heap and i brought it down to 20GB and recommendation from Elasticsearch production documentation was to keep it below 26GB.
(even with 30GB , i had the same issue in prod server)

Do you want me to increase the heap size to 26GB in production server?

It is generally recommended to keep it at 50% of available RAM on the host or ~30GB (whichever is lower). You should ideally try to run with as small heap as possible, but increasing it for now will allow you to monitor it over time and find a suitable level.

@Christian_Dahlqvist: production server has 128GB of RAM and 2TB solid state drive.
So your recommendation is to get the heap size below 20GB and see if the i still get the same issue. If yes, increase the size until i find the right heap value ?

With that much RAM I would keep it at 30GB and observe. The images and logs you presented seems to be from a node with just 3GB of heap, which apparently is far too small.

What is the output of the cluster stats API? How much are you indexing? What type of queries are you running?

screenshots i added was from QA server which has much less RAM compared to production server. I used QA server as guinea pig to reproduce the issue. I will change the production server heap size to 26GB to see if i still get the issue.

we are using match queries and using Elasticsearch score to sort the items.
we index 30k items every 2 hours.

cluster stats
{
"_nodes": {
"total": 1,
"successful": 1,
"failed": 0
},
"cluster_name": "elasticsearch_amslive_production",
"timestamp": 1535316291564,
"status": "yellow",
"indices": {
"count": 12,
"shards": {
"total": 20,
"primaries": 20,
"replication": 0,
"index": {
"shards": {
"min": 1,
"max": 5,
"avg": 1.6666666666666667
},
"primaries": {
"min": 1,
"max": 5,
"avg": 1.6666666666666667
},
"replication": {
"min": 0,
"max": 0,
"avg": 0
}
}
},
"docs": {
"count": 2844355,
"deleted": 759084
},
"store": {
"size": "4.2gb",
"size_in_bytes": 4553532345,
"throttle_time": "0s",
"throttle_time_in_millis": 0
},
"fielddata": {
"memory_size": "8.6kb",
"memory_size_in_bytes": 8808,
"evictions": 0
},
"query_cache": {
"memory_size": "52.7mb",
"memory_size_in_bytes": 55333072,
"total_count": 46205798,
"hit_count": 5479877,
"miss_count": 40725921,
"cache_size": 44766,
"cache_count": 102715,
"evictions": 57949
},
"completion": {
"size": "124.9mb",
"size_in_bytes": 131009310
},
"segments": {
"count": 151,
"memory": "140.5mb",
"memory_in_bytes": 147415900,
"terms_memory": "136.3mb",
"terms_memory_in_bytes": 142923929,
"stored_fields_memory": "719.7kb",
"stored_fields_memory_in_bytes": 737008,
"term_vectors_memory": "0b",
"term_vectors_memory_in_bytes": 0,
"norms_memory": "302kb",
"norms_memory_in_bytes": 309312,
"points_memory": "359.8kb",
"points_memory_in_bytes": 368511,
"doc_values_memory": "2.9mb",
"doc_values_memory_in_bytes": 3077140,
"index_writer_memory": "0b",
"index_writer_memory_in_bytes": 0,
"version_map_memory": "0b",
"version_map_memory_in_bytes": 0,
"fixed_bit_set": "377.8kb",
"fixed_bit_set_memory_in_bytes": 386912,
"max_unsafe_auto_id_timestamp": -1,
"file_sizes": {}
}
},
"nodes": {
"count": {
"total": 1,
"data": 1,
"coordinating_only": 0,
"master": 1,
"ingest": 1
},
"versions": [
"5.3.0"
],
"os": {
"available_processors": 32,
"allocated_processors": 32,
"names": [
{
"name": "Windows Server 2012",
"count": 1
}
],
"mem": {
"total": "127.9gb",
"total_in_bytes": 137402535936,
"free": "81.4gb",
"free_in_bytes": 87436144640,
"used": "46.5gb",
"used_in_bytes": 49966391296,
"free_percent": 64,
"used_percent": 36
}
},
"process": {
"cpu": {
"percent": 1
},
"open_file_descriptors": {
"min": -1,
"max": -1,
"avg": 0
}
},
"jvm": {
"max_uptime": "12.7h",
"max_uptime_in_millis": 45958114,
"versions": [
{
"version": "1.8.0_111",
"vm_name": "Java HotSpot(TM) 64-Bit Server VM",
"vm_version": "25.111-b14",
"vm_vendor": "Oracle Corporation",
"count": 1
}
],
"mem": {
"heap_used": "12.3gb",
"heap_used_in_bytes": 13300491152,
"heap_max": "19.8gb",
"heap_max_in_bytes": 21274230784
},
"threads": 242
},
"fs": {
"total": "126.1gb",
"total_in_bytes": 135451897856,
"free": "85.2gb",
"free_in_bytes": 91525574656,
"available": "85.2gb",
"available_in_bytes": 91525574656
},
"plugins": [
{
"name": "x-pack",
"version": "5.3.0",
"description": "Elasticsearch Expanded Pack Plugin",
"classname": "org.elasticsearch.xpack.XPackPlugin"
}
],
"network_types": {
"transport_types": {
"netty4": 1
},
"http_types": {
"netty4": 1
}
}
}
}

Thank you for helping me out. I am having sleepless nights from last one week on this issue.

@Christian_Dahlqvist : sample query

{
	"from": 0,
	"size": 21,
	"query": {
		"bool": {
			"must": [{
				"function_score": {
					"query": {
						"bool": {
							"should": [{
									"term": {
										"itemNo": {
											"value": "SKP PRO AUDIO DTOUCH 20 DIGITAL MIXING CONSOLE TOUCHSCREEN WIFI 20INPUTS/16BUS/8OUTS MIXER WI FI",
											"boost": 3.0
										}
									}
								},
								{
									"match": {
										"shortDescription.custom": {
											"query": "skppro audiodtouch 20digital mixingconsole touchscreenwifi 20inputs/16bus/8outs mixerwifi",
											"operator": "OR",
											"prefix_length": 0,
											"max_expansions": 50,
											"minimum_should_match": "6",
											"fuzzy_transpositions": true,
											"lenient": false,
											"zero_terms_query": "NONE",
											
											"boost": 4.0
										}
									}
								},
								{
									"match": {
										"metaWords.custom": {
											"query": "skppro audiodtouch 20digital mixingconsole touchscreenwifi 20inputs/16bus/8outs mixerwifi",
											"operator": "OR",
											"prefix_length": 0,
											"max_expansions": 50,
											"minimum_should_match": "6",
											"fuzzy_transpositions": true,
											"lenient": false,
											"zero_terms_query": "NONE",
											"boost": 5.0
										}
									}
								},
								{
									"match": {
										"longDescription.custom": {
											"query": "skp pro audio dtouch 20 digital mixing console touchscreen wifi 20inputs/16bus/8outs mixer wi fi",
											"operator": "OR",
											"prefix_length": 0,
											"max_expansions": 50,
											"minimum_should_match": "6",
											"fuzzy_transpositions": true,
											"lenient": false,
											"zero_terms_query": "NONE",
											"boost": 1.0
										}
									}
								},
								{
									"match": {
										"keyWords.custom": {
											"query": "skp pro audio dtouch 20 digital mixing console touchscreen wifi 20inputs/16bus/8outs mixer wi fi",
											"operator": "OR",
											"prefix_length": 0,
											"max_expansions": 50,
											"minimum_should_match": "6",
											"fuzzy_transpositions": true,
											"lenient": false,
											"zero_terms_query": "NONE",
											"boost": 1.0
										}
									}
								},
								{
									"match": {
										"specification.custom": {
											"query": "skp pro audio dtouch 20 digital mixing console touchscreen wifi 20inputs/16bus/8outs mixer wi fi",
											"operator": "OR",
											"prefix_length": 0,
											"max_expansions": 50,
											"minimum_should_match": "6",
											"fuzzy_transpositions": true,
											"lenient": false,
											"zero_terms_query": "NONE",
											"boost": 1.0
										}
									}
								},
								{
									"bool": {
										"must": [{
												"match": {
													"itemGridSpecifications.shortDescriptionSpecification.custom": {
														"query": "skppro audiodtouch 20digital mixingconsole touchscreenwifi 20inputs/16bus/8outs mixerwifi",
														"operator": "OR",
														"prefix_length": 0,
														"max_expansions": 50,
														"minimum_should_match": "6",
														"fuzzy_transpositions": true,
														"lenient": false,
														"zero_terms_query": "NONE",
														"boost": 1.0
													}
												}
											},
											{
												"term": {
													"itemGridSpecifications.displayInSearchFilter": {
														"value": true,
														"boost": 1.0
													}
												}
											}
										],
										"disable_coord": false,
										"adjust_pure_negative": true,
										"boost": 1.0
									}
								},
								{
									"bool": {
										"must": [{
												"match": {
													"itemAttributes.shortDescriptionAttribute.custom": {
														"query": "skppro audiodtouch 20digital mixingconsole touchscreenwifi 20inputs/16bus/8outs mixerwifi",
														"operator": "OR",
														"prefix_length": 0,
														"max_expansions": 50,
														"minimum_should_match": "6",
														"fuzzy_transpositions": true,
														"lenient": false,
														"zero_terms_query": "NONE",
														"boost": 2.0
													}
												}
											},
											{
												"term": {
													"itemAttributes.displayInSearchFilter": {
														"value": true,
														"boost": 1.0
													}
												}
											}
										],
										"disable_coord": false,
										"adjust_pure_negative": true,
										"boost": 1.0
									}
								}
								
							],
							"disable_coord": false,
							"adjust_pure_negative": true,
							"boost": 1.0
						}
					},
					"functions": [{
						"filter": {
							"match_all": {
								"boost": 1.0
							}
						},
						"field_value_factor": {
							"field": "rank",
							"factor": 10.0,
							"modifier": "log1p"
						}
					}],
					"score_mode": "sum",
					"boost_mode": "sum",
					"max_boost": 3.4028235E38,
					"boost": 1.1,
					"_name": "function_score"
				}
			}],
			"filter": [{
				"bool": {
					"must": [{
						"term": {
							"includeInSearch": {
								"value": true,
								"boost": 1.0
							}
						}
					}],
					"must_not": [{
							"term": {
								"active": {
									"value": 3,
									"boost": 1.0
								}
							}
						},
						{
							"match": {
								"status": {
									"query": "DC",
									"operator": "OR",
									"prefix_length": 0,
									"max_expansions": 50,
									"fuzzy_transpositions": true,
									"lenient": false,
									"zero_terms_query": "NONE",
									"boost": 1.0
								}
							}
						}
					]
				}
			}]
		}
	}
}

@Christian_Dahlqvist : do you see any issues in cluster stats or Search query ?
I am using JDK v111 and I am going to upgrade it to JDK v152 (last suggestion in https://github.com/elastic/elasticsearch/issues/26269) to see if it helps.
Also planning to change the number of shard to 1 from 5.

The statistics looks fine, so it seems your queries might be very memory-intensive. I do however not have a lot of experience analysing memory usage of fuzzy queries, so will have to leave that for someone else.

This topic was automatically closed 28 days after the last reply. New replies are no longer allowed.