I'm thinking I have a node in my cold tier that is "hung" or in a bad state (hereafter referred to as instance 15, see screenshots). Like it's in the cluster but it's not fully in the cluster. Long story on how we got into this state, I'm actually not totally sure. We ended up with hundreds of UNASSIGNED shards in data stream. Theory: those were elected to be moved to cold tier based on ILM, and then one of the primary / replica shards were not able to be sent to the hung node.
I got the cluster back to a good state by adjusting ILM to remove older shards, and added another cold node (now 3). Thought we were "good" so now changed configuration back to 2 nodes. Now we're heading back into a bad state: UNASSIGNED shards showing up again, instance 15 still just idle (seems to not participate) and instance 18 is unhealthy (assuming that was elected as the node to remove).
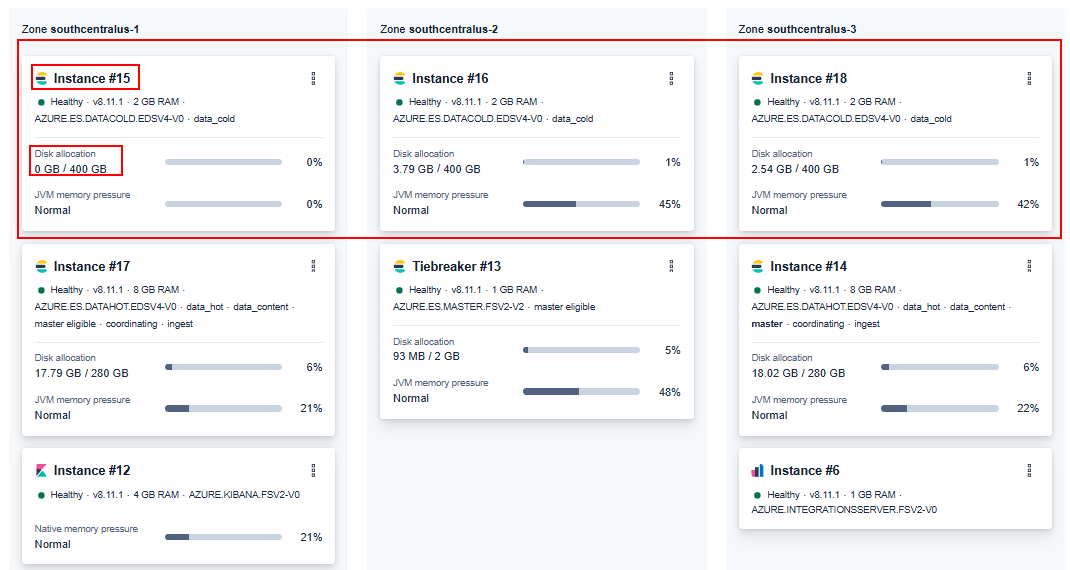
In the cloud portal overview, I see all 3 cold tier nodes.
In the stack monitoring list, I only see 1 cold tier node (instance 16).
In the output from _cat/allocation I see only 1 cold tier node and one UNASSIGNED.
Any thoughts on how to get instance 15 either woken up and really joined, or removed so it's not looked to be part of the cluster?
(or prove to myself that it actually IS alive but something else is wrong?)
Thank you so much for at least reading this far!
Cloud portal overview for the cluster. (with configuration change still in progress, thinking it's stuck after 3 hours - since there's nowhere to put the shards on another cluster besides 16. 18 is the one being removed and 15 is not really in the cluster)
Yes, I have an open ticket with support.
To be honest, it has been a LONG road of back and forth and around and round. I'm not convinced they are chasing down the right places for me. Discussing how instance 15 runs out of memory when first starting (haven't seen any evidence of that).
Thought I would check out here if any of you gurus had seen this or had ideas on what to look for.
Yeah, unfortunately I had similar experiences, my suggestion would be to try to contact your Sales rep if you have one to see if you can get some priority or if you have someone dedicated to your account, but I think this depends on the contract type.
Normally you can get some help on the forum, but this seems related to the infrastructure on Elastic Cloud, so it depends on Elastic.
Could you please confirm if the plan was successful of removing the cold nodes? At first place i believe the plan was not succesfull because of which we might see this status for the cluster.
Is below command showing any reason the unassigned shards? GET /_cluster/allocation/explain
Heard back from support. The configuration change was in a wait state waiting until master instances are elected and my understanding is the support rep was able to "bump" the cluster 15 that was kind of idle or disconnected. This allowed the configuration change to continue.
We are now back to healthy state with all shards assigned (STARTED) and only 2 nodes in cold tier that are both healthy.
GET _cluster/health status is now GREEN
Very weird scenario that got us to the state I document above. I'm still not sure how / if I could recover from it on my own. I suppose I will dig along with support again in the future if this happens.
Apache, Apache Lucene, Apache Hadoop, Hadoop, HDFS and the yellow elephant
logo are trademarks of the
Apache Software Foundation
in the United States and/or other countries.